
One of the things I come across time and again is a lack of monitoring in what are supposed to be corporate environments. I am honestly surprised at how little monitoring is carried out on infrastructure. These days, it is quite possible to carry out some very in-depth monitoring by using a freely available software on Linux and Windows. In this article, I’m going to go through the various monitoring tools that I use to monitor both production and my lab environment.
Having extensive monitoring in a lab is handy when testing systems as not only are it possible to get an idea of the sorts of information you can get from the device when it’s in production but you also get to see how it works thanks to having a greater visibility of the system. These little insights are always handy for putting into documentation ahead of deploying to production plus it’s a huge help when you’ve already seen error messages before and have a clearer understanding of what may have caused them.
When talking about monitoring, I like to approach it as a full circle of monitoring the application or hardware. I like to monitor both the OS it’s sitting on, the application, the network connection, and VLAN it’s using plus any externally exposed endpoints. This way, if there is an issue, not only should I be able to see how the issue occurred but I should also be able to see what preceded it which will allow me to get the fullest picture possible of the state of the environment at the time the issue occurred.
The first set of monitoring I want to start with is Centralised logging. The Linux world has been lucky to have the ability to send logs to a central server for some time now and this feature was provided with Windows event logs when Windows 2012 R2 arrived, called event log forwarding it’s something that I doubt that many people have set up. It certainly doesn’t help that the install is rather convoluted!
Personally, I prefer to send all my logs to a central server and I can do this with Graylog acting as the receiving host. Once setup and with GELF and syslog ports open, Graylog is ready to receive syslog from Linux servers, on Windows a small application is required.
For this, I use Nnxlog to send the log files to Ggraylog with a very simple “send everything” configuration which you can see here.
Nxlog allows for filtering of logs, so it’s quite possible to only send the errors or warnings to Graylog but, personally, I prefer to send everything as it’s a more complete picture.
By sending all the windows event logs and using the syslog stack in Linux, not only do I have all my Linux logs in one place but I can also get all of the logs from my networking kit, storage arrays, and Windows boxes all going to the same centralized log store.
It then becomes very easy to ask it questions such as “Show me everything that happened at 17:01 last Friday” without having to connect to each individual device and pull those logs down by hand. This sort of capability becomes even more critical when an environment scales up behind a few tens of devices.

Graylog has the advantage of having a Boolean search logic front end which makes It very easy to search for particular events. For example, you can search across all Windows servers for a particular event ID. You can also take things a step further and setup Graylog alerts so that if a server generates an event ID in windows or particular line in a syslog or other log that is being sent to it, you get an alert for it.
As an example, I’ve done this for any replication errors on any domain controller. This gives me a great heads up about any potential issues with AD.
Graylog does have a few pre-requisites as it needs both Elastic search and MongoDB to be installed. It also needs some configuration file editing to get it up and working but with every update, the install process gets easier. Graylog has also just released a container image which may make deployments even easier.
Performance Metrics – Whilst Graylog is a great tool for delving into log files it’s not much help when it comes to visual representation of potential issues. This is one reason why you also need a graphing solution. Graphite is a known tool that will display metrics sent to it as a graph. Install Grafana on top and you’ve got a truly impressive visualization tool that can be used to receive all sorts of metrics from Windows and Linux servers. Graylog is a fairly easy install even though it has a few pre-requisites and everything.
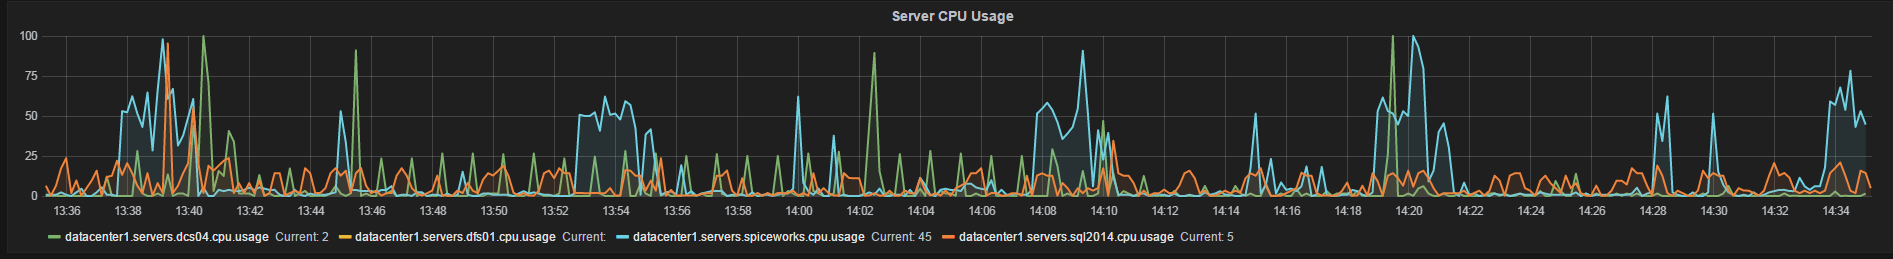
Like Graylog, the Graphite and Grafana combination needs agents on the Linux and Windows boxes to be able to send metrics to Graphite. In the case of Linux, StatsD is the agent of choice and for Windows, it has to be telgraf. The one drawback of Graphite is that the install is rather old style Linux in that it requires some manual installation steps. The process is a lot better than it has been but it could still be more improved.
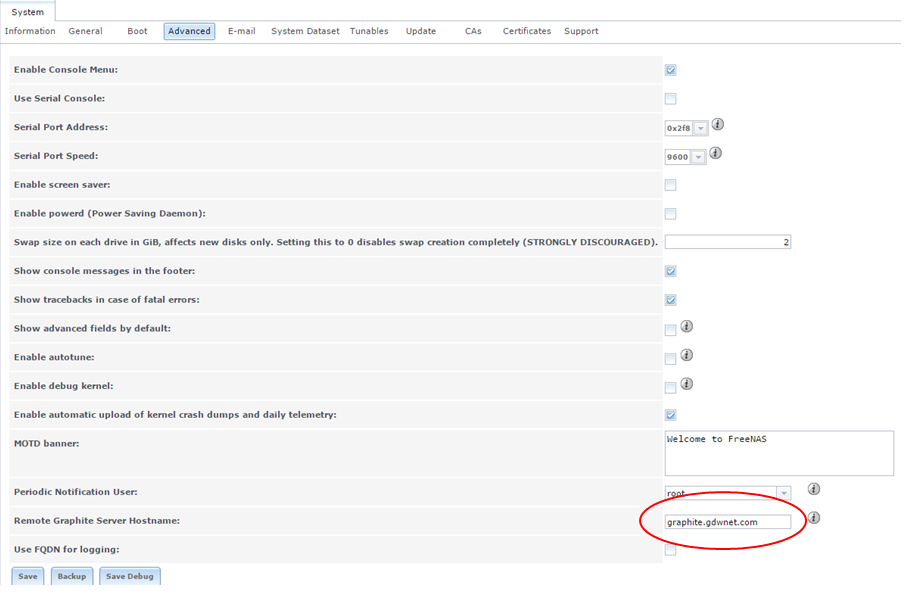
There are some systems out there that can now send metrics directly to Graphite without the need for any special scripts or plugins. FreeNAS recently included this ability in their FreeNAS storage OS.
Bandwidth Monitoring – On the networking side there are quite a few tools out there which will poll switches and routers and provide useful stats, personally, I like Observium. It’s free, lightweight and once configured it works very well. It does require a newer version of PHP than Centos 6.x natively supports in its yum/RPM repository and while there are ways of setting this up it’s also a little bit fiddly, it works perfectly well on CentOS 7.x
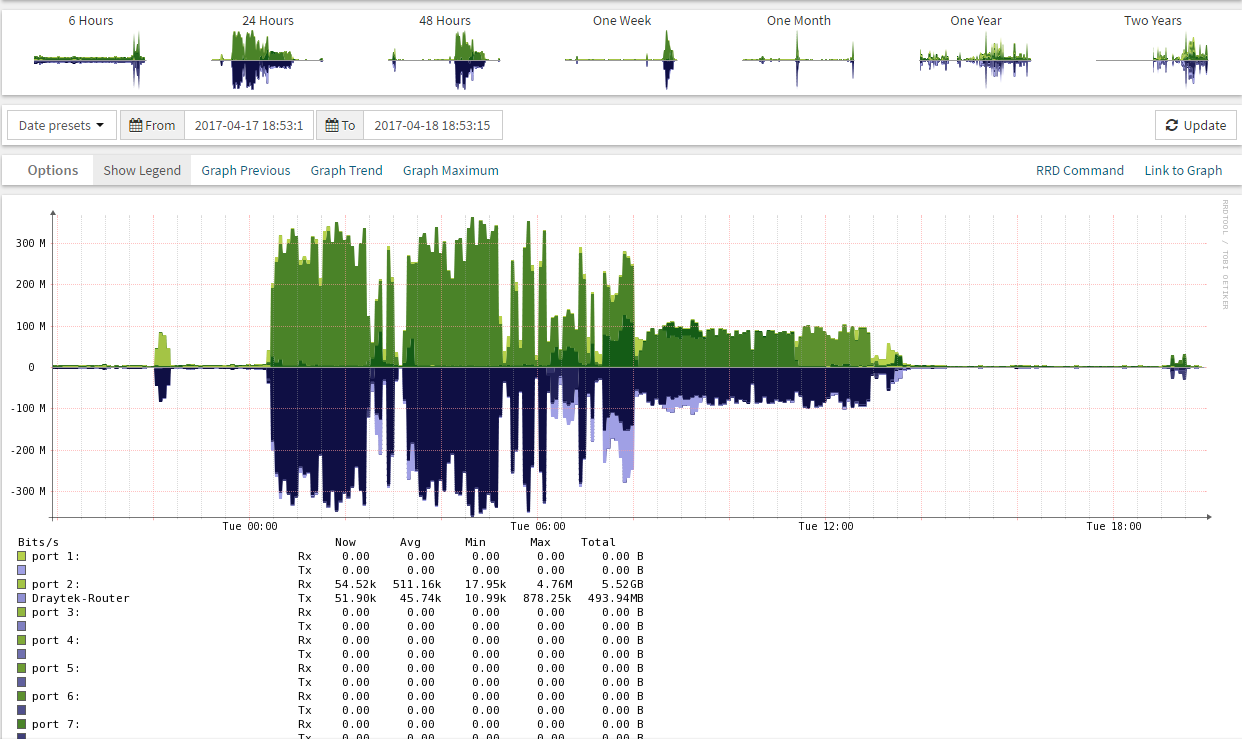
The Observium screenshot above shows overall traffic on a switch, the large traffic spikes in the above screenshot are from the overnight backup and this perfectly illustrates why I like these tools, they provide a very nice visual feedback on what is going on.
Status – A key part of any monitoring environment is the status tool, this is simply a monitor that tells you if a service and/or system is up or down or if a server is running low on disk space. For this, I use Check_mk which is basically a massive and very configurable front end to Nagios.
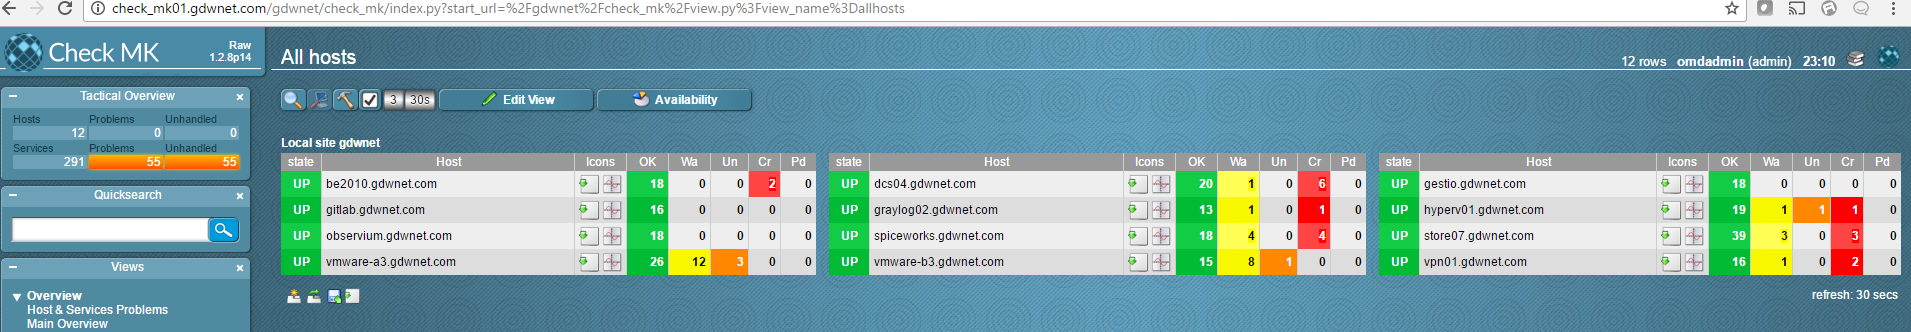
The nice thing about Check_mk is that it’ll not only tell you when a server is down or low on disk space but it’ll tell you if a service is running on a different node in a cluster. This has proven to be very useful in the past as cluster issues have occurred and no one has realized, at least with check_mk monitoring, it’s clear when a service has failed over to another node. It also has plugins for a lot of popular hardware such as Dell OpenManage and, with this installed you can see straight away should a disk, PSU or other component fail. Check_MK is very easy to install as it is shipped with an automatic installer.
 |
StarWind Cloud VTL for AWS and Veeam is built on the Virtual Tape Library, a well-proven and reliable technology allowing to accelerate backup processes. It enables Veeam users to offload their backups to AWS to enhance their IT infrastructures and meet the 3-2-1 backup rule. |
| Find out more about ➡ StarWind Cloud VTL for AWS and Veeam. |
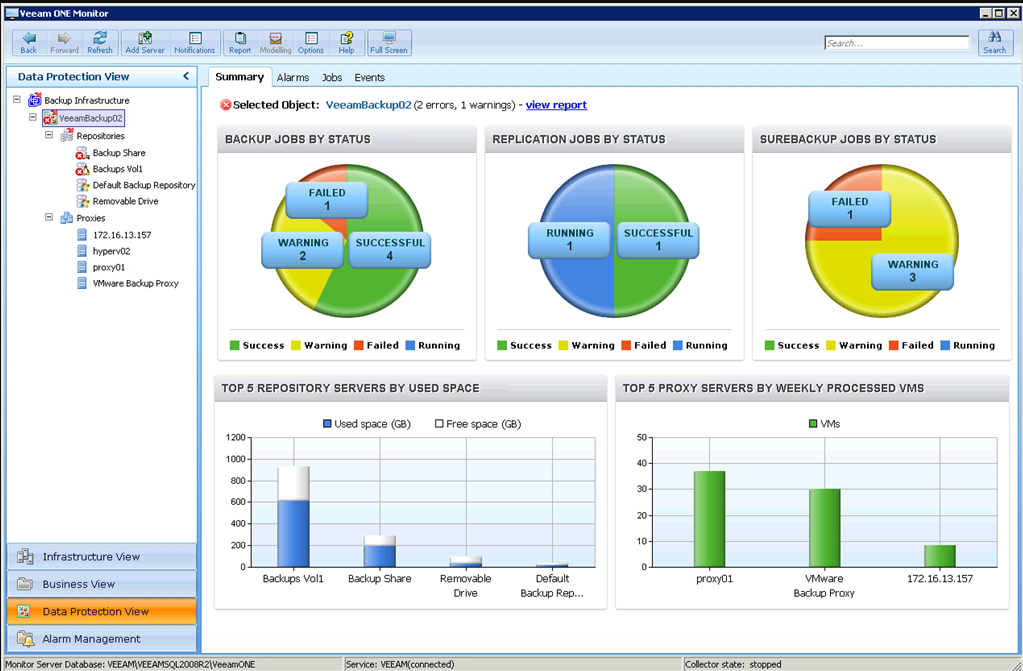
VM and Hypervisor Monitoring
While the tools above give a very nice view of what each server is doing along with metrics, messages and so on, one layer that’s still missing is the VM layer. There is a lot of information about the state of VM’s per host that need to be monitored and reported against, especially as it’s easy to over-provision a host or miss a snapshot, these things and more can cause all sorts of performance issues so it’s something that needs monitoring, and and for this I’m using the Veeam One monitor. As Veeam themselves say, this tool will always tell you something you didn’t know about your environment.
Inventory
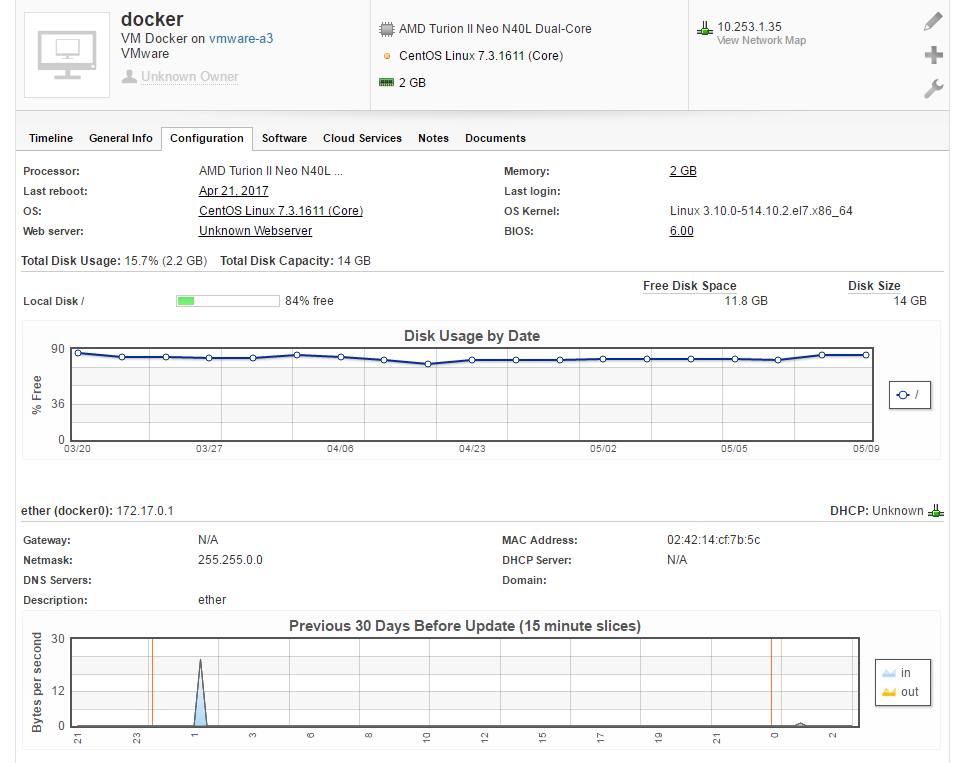
The final internal tool I’ll talk about isn’t a monitoring tool as such but it is still important. It’s an inventory tool, something that’ll go out and find all the servers and other devices on your network and report on them. These tools are really required more to keep track of assets and changes in those assets. For this, I’m using the Spiceworks helpdesk tool which, as a core component, has a very nice inventory tool set which has the ability to monitor software that is installed and removed, upgrades, changes and many other things.
External endpoint monitoring.
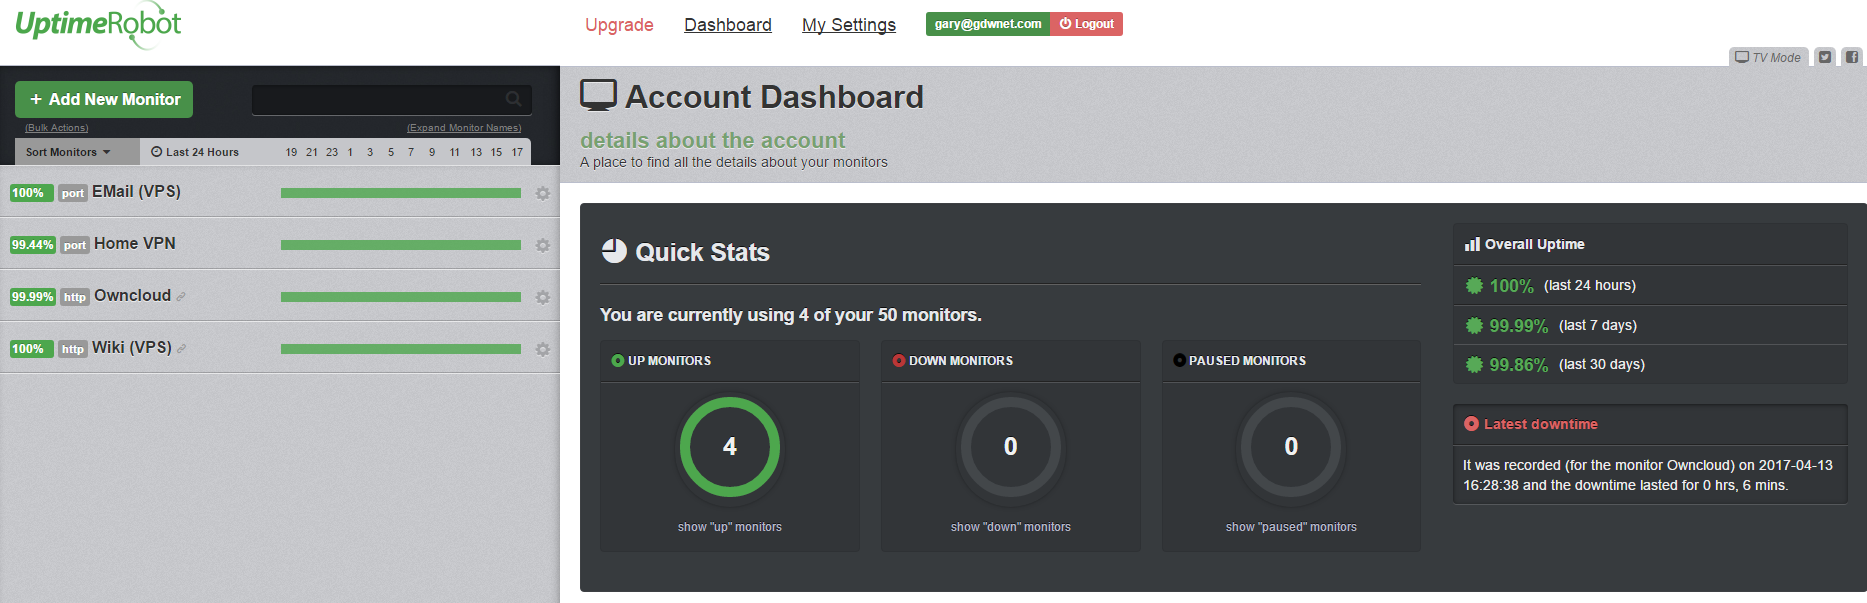
Finally, the last point that I monitor are my endpoints, servers that are available to the internet in one form or another, be that from my network or hosted somewhere like AWS. In this case, I use Uptime Robot which checks the endpoints every 5 minutes from multiple locations and will send out an alert if that endpoint is not available from several locations. For 50 monitors and the 15-minute check interval, Uptime Robot is free, for a fee you can get a lot more features but I’ve found that the basic set works perfectly well for me.
For me, a monitoring setup really is a must in all but the very smallest of environments and a definite in lab environments just because of the additional information that it’s possible to pick up when using such tools. It’s very useful to be able to see the sort of metrics and messages that a system will send out when it’s in production. It’s also a great way to see and document the potential error messages that a system may display when in production.
All of the tools I’ve written about here are free in terms of purchase cost. There is still a cost in the time required to set them up and configure them and there is a cost in terms of compute and disk space. Graylog can be especially heavy on disk space and Graphite is rather fiddly to install but, it’s all worth the time as these tools will provide key insights into what is going on with the network, servers, switches and so on. All of this is beyond invaluable when problems occur.