
Working with vRops over the last years has taught me one thing. The development of vRops goes so fast. Sometimes so fast that you do not realize when or what has changed. However, there are many “hidden” gems in vRops, which will make you and the product shine even more.
So come along, as I will show you my top ten hidden gems of vRops…
1. “is” metrics
vRops does many different analyses based on different metrics. Some of these analyses get available in the interface for consumption and easier understanding of the VMs behavior.  Three of those metrics are “is idle”, “is oversized” and “is stressed”. The cool part of this is that these are easy to understand metrics and does not get applied to just a VM or a Host, but also hardware, virtual or not as can be seen in the picture.
“Is idle”, means that the object has a very low utilization – More about this can be read here.
“Is Oversized”, is based on utilization of the object.
“Is Stressed”, is based on the stress settings in the policy. By default, stress would mean an object, which uses more than 70% of its resources for any given 60-minute window.
So just by looking at these three metrics, you have learned a lot about the VM.
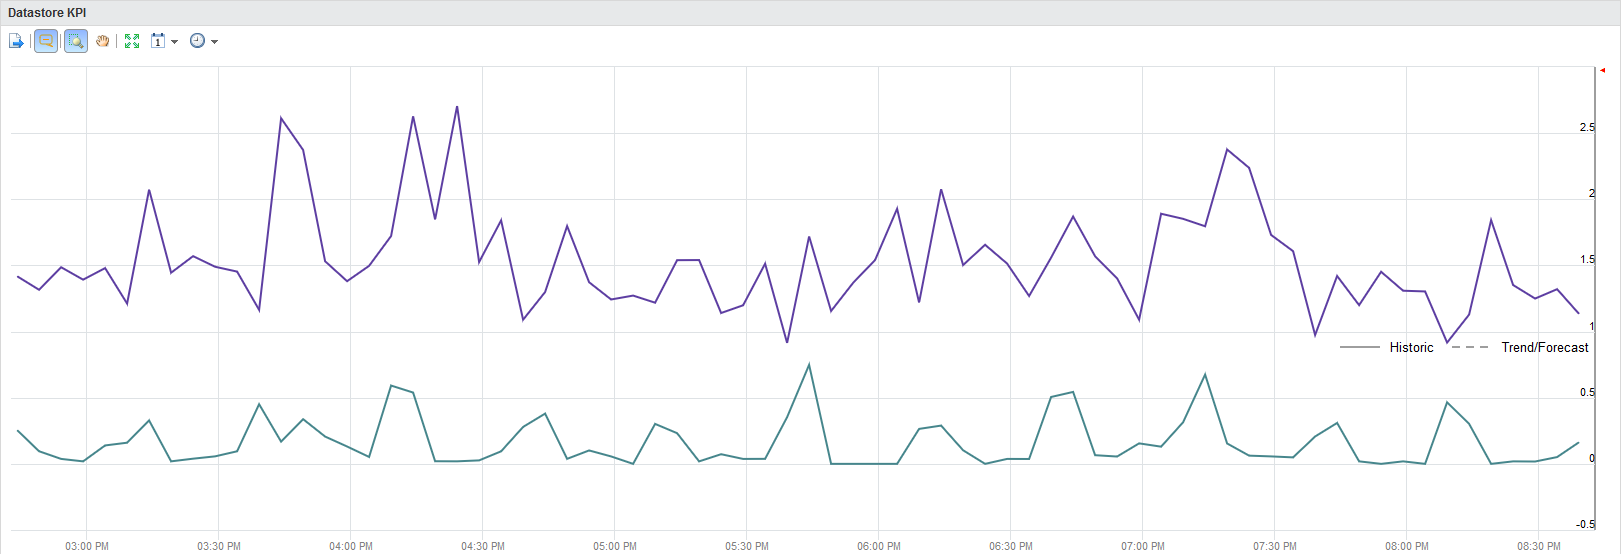
2. Datastore KPI view
vRops comes with a lot of default views one of them is the datastore KPI view. What it does is give you a very quick understanding of how the latency of the datastore has been over time. In this case for reads and writes.
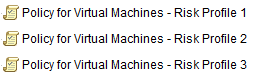
3. vSphere Hardening Guide
This has come a long way if you ask me. Up to the point now that you are able to create your own security baseline. The way it works is that now you can enable either one of the risk profiles from the vSphere hardening guide or you can create your own. Creating your own is based on the security properties which are now exposed in vRops. This means that you can easily create symptoms and alerts around the security properties.
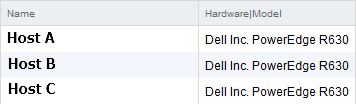
4. Properties
Properties use to be hidden away, not to be easily consumed. The number of properties has also grown quite a lot over the last few released. Now to include more hardware features, such as CPU model, Hardware vendor, but also hardware make and model. Which makes it a lot easier to do hardware refreshes in a large environment.
5. Contention view
I have saved the best until last. The contention view comes in two flavors CPU and Memory. It can be run on clusters or higher objects and shows you in all its glory, how much contention there is in clusters.
Therefore, without any delay here it is!
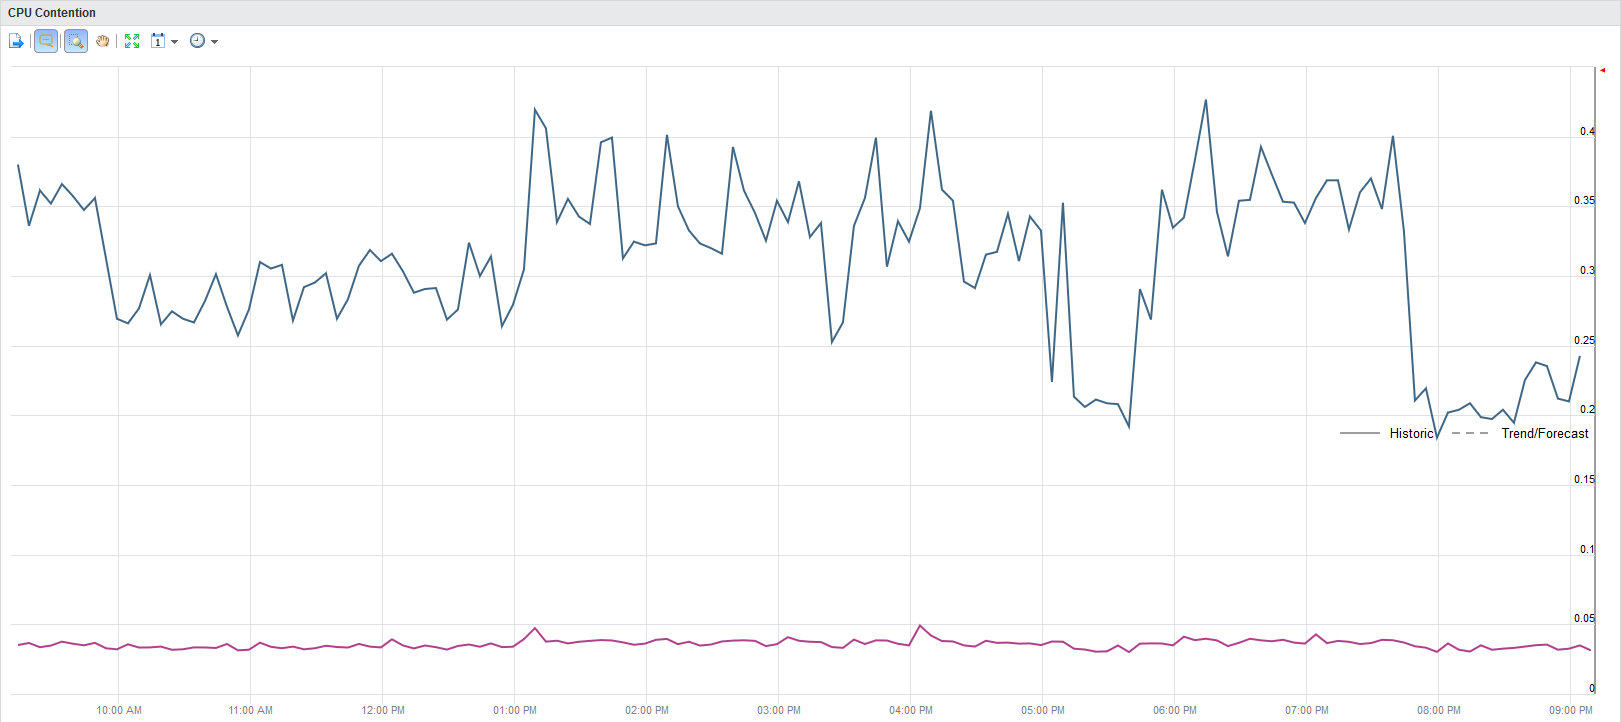
The blue line is maximum contention for CPU and the red one is averages CPU contention.
This makes it super simple to see if every VM demand is being filled in the way intended. Simply looking at this view you will know if your cluster and VMs is running well.