
vRops 6.3 has been announced. I have already upgraded a test environment of mine and a few production environment and are talking to customers who what’s to upgrade asap. There are different great features that make an upgrade worthwhile.
Before I jump in and show case all the cool improvements and added features. A word of caution BEFORE upgrading make sure all endpoint operations agents have been upgraded. vRops 6.3 is not backward compatible with 6.x agents.
From the vRops release notes 6.3 – http://pubs.vmware.com/Release_Notes/en/vrops/63/vrops-63-release-notes.html?src=vmw_so_vex_mryom_838
“Updating the Endpoint Operations Management Agent
You must update Endpoint Operations agents to version 6.3 before you update vRealize Operations Manager to version 6.3. There is no backward compatibility for previous versions of Endpoint Operations Management agents and vRealize Operations Manager 6.3 only works with version 6.3 of Endpoint Operations agents.
Separate processes are required for updating vRealize Operations Manager and for updating the Endpoint Operations Management agent.
Before you can update an Endpoint Operations Management agent, you must satisfy various prerequisites. A specific process must be followed to ensure a successful update. The necessary information is documented in these KBs: KB 2146446 and KB 2146447.”
Another word of caution, the maintenance schedule have changed. In vRops 6.x, maintenance schedules are not compatible with 6.3 maintenance schedules. All maintenance schedules prior to 6.3 will have to be recreated!
From the vRops release notes 6.3 – http://pubs.vmware.com/Release_Notes/en/vrops/63/vrops-63-release-notes.html?src=vmw_so_vex_mryom_838
“After you update your previous version of vRealize Operations Manager from 6.2.0a to this version, any maintenance schedules that you created before the upgrade and applied to specific objects, do not appear in the user interface. This change in behavior is by design, and is not backward compatible with previous versions.”
vRops 6.3 What’s new
This is a walkthrough new features and enhancements in vRops 6.3. Just below you can see a list of subjects I’m going to cover. This can help you to easily jump to the subject of interest. The aim here is to have a complete list of what’s new in vRops 6.3, as there seems to be too many doing copy/paste or partial updates based mostly on what’s in the release notes. The official “vRops 6.3 what’s new” can be found here. It is worth a look, though all should be covered in details below.
There is another important statement in the release notes I want to touch upon. The dead of vRops on Windows is coming. The statement from the release notes is pretty clear about it.
Note: Although the Microsoft Windows-based installation option and our Microsoft Windows-based Remote Collector option are fully supported in vRealize Operations Manager 6.3, we are deprecating their support. Future availability of these options is not guaranteed.
For new deployments, we recommend the use of our Virtual Appliance option. The announcement of the End-of-Availability (EOA) for these Windows-based options will come in a later release.
Table of content
Data Collection Notification toolbar
Log Insight integration enhancements
Views time settings enhancement
vSphere Distributed Resource Scheduler (DRS) Integration
API
From the release notes, it says there is a “New API Programming Guide”. Therefore, that must mean that there has been made updates to the API documentation. New in vRops is schema1.xsd. So minor updates to the API documentation and the exposure of the XML Schema file is what seems to be new in the vRops API documentation. In addition, brand new in this release is the Cluster Management API. As with the traditional vRops API, the documentation is hosted on the vRops node itself. The URL as an example is “vRops.MichaelRyom.dk/casa/api-guide.html”, just change vRops.MichaelRyom.dk to suit your vRops installation.
What you can do with this new API is to do cluster configuration and setup. The below table has been copied/pasted from the documentation in order to help you understand what this API does.
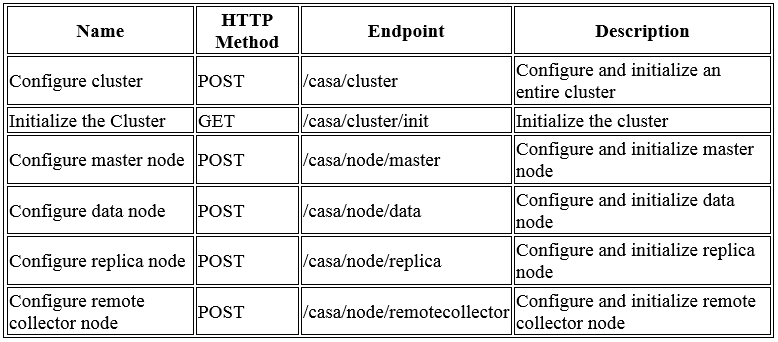
Configure DRS
![]()
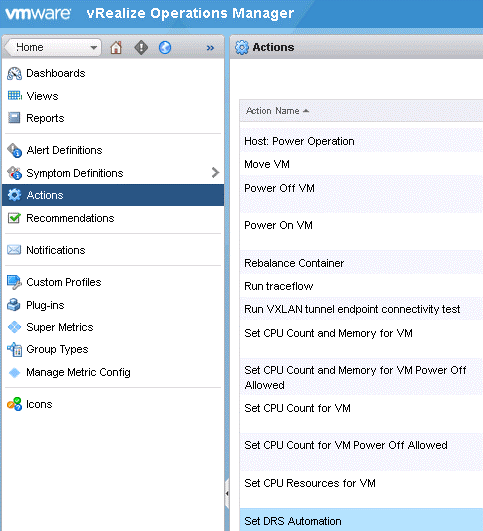
This is a new feature in vRops. At its core, it is a new action called “Set-DRS-Automation”. This can be used to change the
DRS settings on a DRS cluster. That way you will be able to quickly change the DRS settings without leaving the vRops interface. The way it works it that it can be tied together with recommendations (it’s already used in three cases) and executed via the vCenter adapter’s vCenter action settings, which needs to be configured before. There is a new “vSphere DRS cluster settings” dashboard were in this feature can be used. More about that in the dashboard section.
Data Collection Notification toolbar
![]()
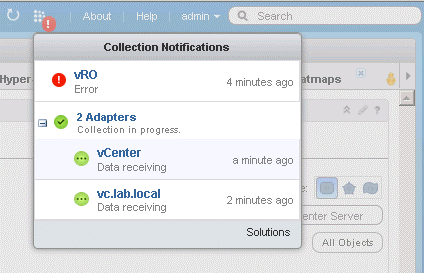
This might seem like a small thing, but I have already grown very fond of it. In the top navigation bar, there is now a new icon. This icon will have a red circle with an exclamation mark in it, if there are one or more adapters not collecting. Clicking on the icon gives you a quick overview of the status of the adapters. It is easy to read which has problems and which do not. Another nice thing is that you can see the time since last collection. Very useful when waiting to changes to kick in. Lastly, there is also a little button, which takes you directly to solutions. A very neat little add-on, which helps better the flow of how you use vRops.
Dashboards
Here is one of the areas where you will see the changes and the new features. Two new dashboards, called “Home” and “vSphere DRS settings”, plus six other dashboards, which are grouped under “Self Services”. These have to do with monitoring the vRops environment itself. Seems quite useful if you ask me. There are two new features, which I particularly like. It’s the ability to place a widget where ever you like and the ability to resize the widget as you like. This has been much needed. This helps with the overall feel that now seems much more modern. Nevertheless, there is even more! I will just list these here, before I show you more about them.
- New Home dashboard
- New widget Recommended Actions
- New vSphere DRS Cluster Settings dashboard
- New widget DRS Cluster Settings
- New self services dashboards – Six in total
- New SDDC Health Dashboards (A new Management Pack)
- Free widget layout
- Resize of widgets
- UX/UI improvements
- Perform actions via the Workload Utilization dashboard
- Filter options added to Workload Utilization dashboard
Home dashboard
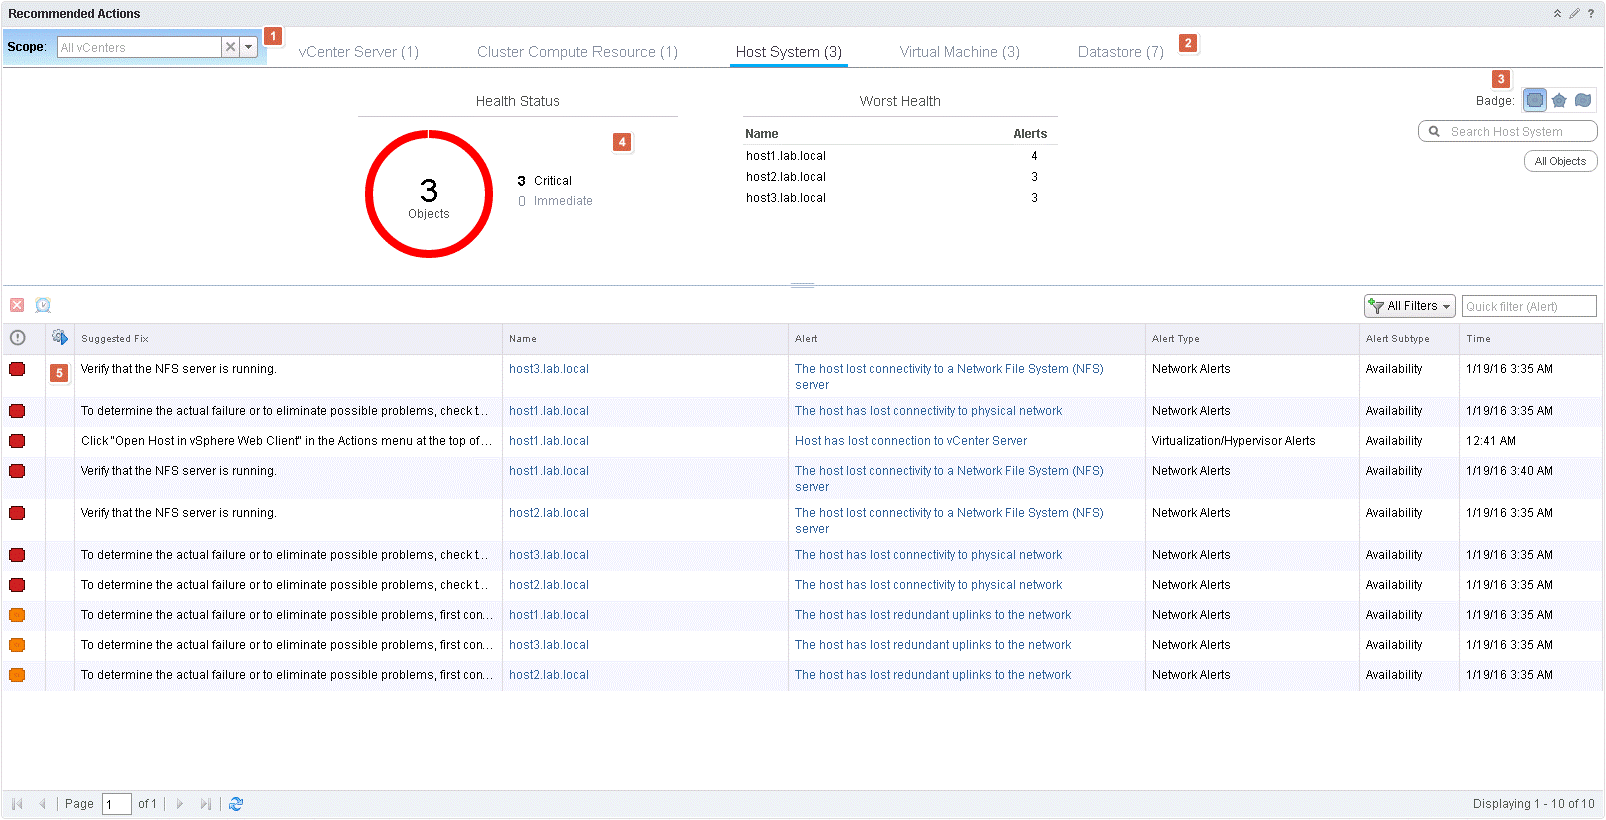
The home dashboard is the new default home for when you login to vRops. It will give you a quick overview of your environment and the issues that might be there. At the same time, it is also great for digging deeper down in parts of the environment as it features rich filtering options. Let me walk you through the basics. In a large/multi-site/multi vCenter environment the first option to filter on is scope (1). From there you can choose a specific vCenter, instead of looking at all of them at once. Next option (2) is to choose which object type you want to see recommendations about. That leads us to badge and search options (3). The default badge is health, but here you have the option to choose one of the major badges. Just below is a search field if you want to narrow down which object you are looking to get recommendations about. Note the field below the search box where is says “All Objects”, this will change according to what object you have chosen from the search box. Health status (4) shows a pie chart, colored by criticality and next to it is Worst Health, which lists the top objects order by which has the most critical alerts to attend to. Below all this, we see the alert and suggested to fix for each. What is very neat here is column number two (5). Here an icon will appear if there is an action assigned to the specific suggested fix. This will help to get the problem fixed faster, as you can skip the whole going back and forward between different GUI’s.
Recommended Actions
You have already seen this! What you see on the Home dashboard is just one widget. The Recommended Actions widget. Therefore, now that you have seen it and understand what it is, there is no reason to explain this widget anymore. Let us move on.
vSphere DRS Cluster Settings dashboard
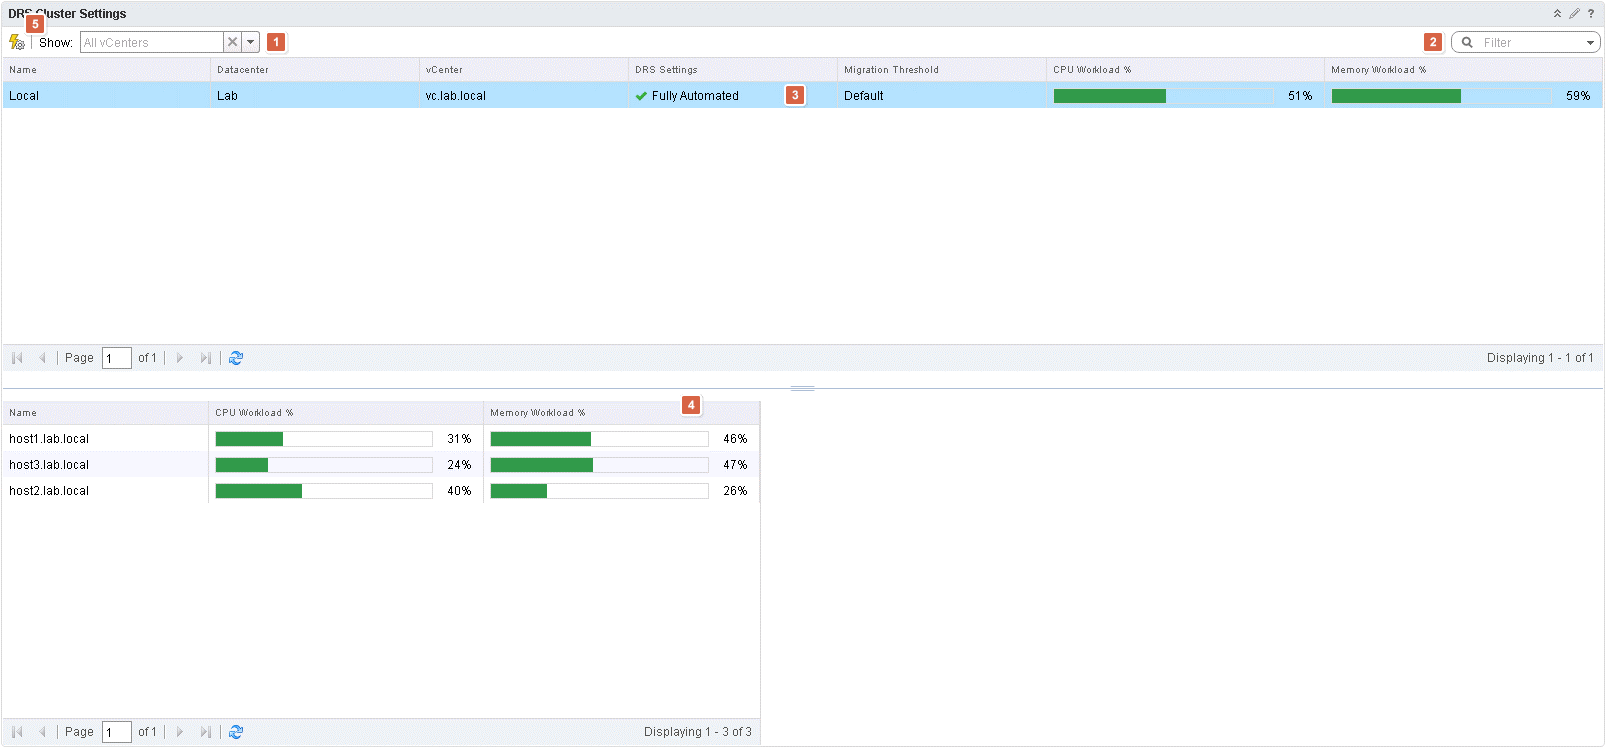
This is another of the new dashboards, which are available. This one, as the name suggest covers DRS Cluster settings. When we are talking DRS and cluster settings, what they really means is automation level. This give your insight into cluster settings. In my simple environment, this does not do much for you. It is not hard to imagine how this will look in a large environment. Let us walk through the dashboard. First of there is the ability to limit (1) the shown clusters. In very large environments, this is very useful. Continuing from there. There is the possibility to filter (2) by using the searches via the search filter box. Underneath all this, there is a list of clusters (3) or lack of 🙂 Here there are some basic cluster stats available, such as Datacenter, but more useful is “DRS Settings”, CPU and Memory workload. This gives you a very quick and easy overview of cluster settings but also their hosts (4). Within this single dashboard you are able to get an idea about if it is safe to use the the clusters for more workloads. Lastly, the icon next to (5), helps to automate the need to do changes to the DRS settings. As can be seen under vSphere Distributed Resource Scheduler (DRS) Integration.
DRS Cluster Settings
Next up is the DRS Cluster Settings widget. Guess what; it is what I just showed you. Just like the Home dashboard, the vSphere DRS Cluster Settings dashboard is just one new widget. Again, I will keep it short here. You have already seen it, so let us not waste any more time on it.
Self Services dashboards
It does not stop with just two new dashboards. There is an all-new series of dashboards called “Self Services”. These can be found under dashboard list. There are six new dashboards. I will go through them all in a moment, but first these dashboards need to be visible from Home.
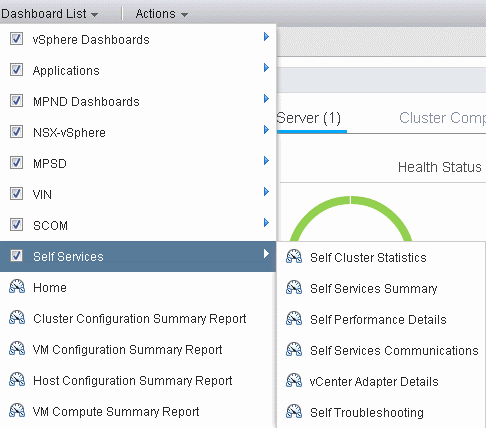 The six self services dashboard:
- Self Cluster Statistics
- Self Services Summary
- Self Performance Details
- Self Services Communications
- vCenter Adapter Details
- Self Troubleshooting
These dashboards are not visible out of the box. This means that first we have to enable them in order to see them. For you to enable them, click on “content” (1) and “dashboards” (2). Depended on how many dashboards you have you might need to filter, sort or just find it by clicking “next page” arrow in the bottom of the page. Once found (3) mark them, click the actions gear icon (4), and click on “Add Dashboard(s) to Home”. Note the “Self Health” is an old dashboard and not part of the six new self services dashboards.
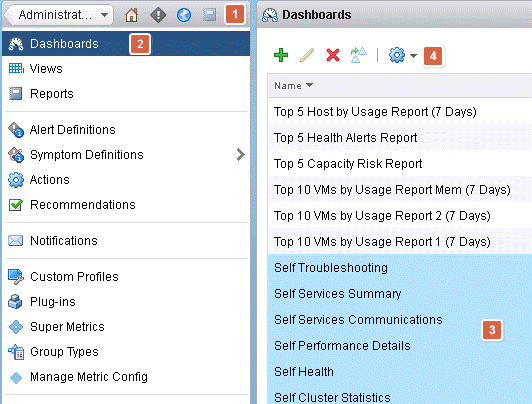
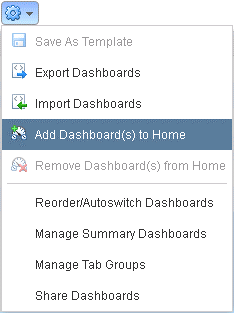
After adding the dashboard the Home, verify that there is a green check mark next to each dashboard and you are good to go. Note: Self Health is not part of the self services dashboards.
Remember to enable the dashboard called “vCenter Adapter Details”, as this is part of the self services dashboards. Now let’s look at the dashboards.

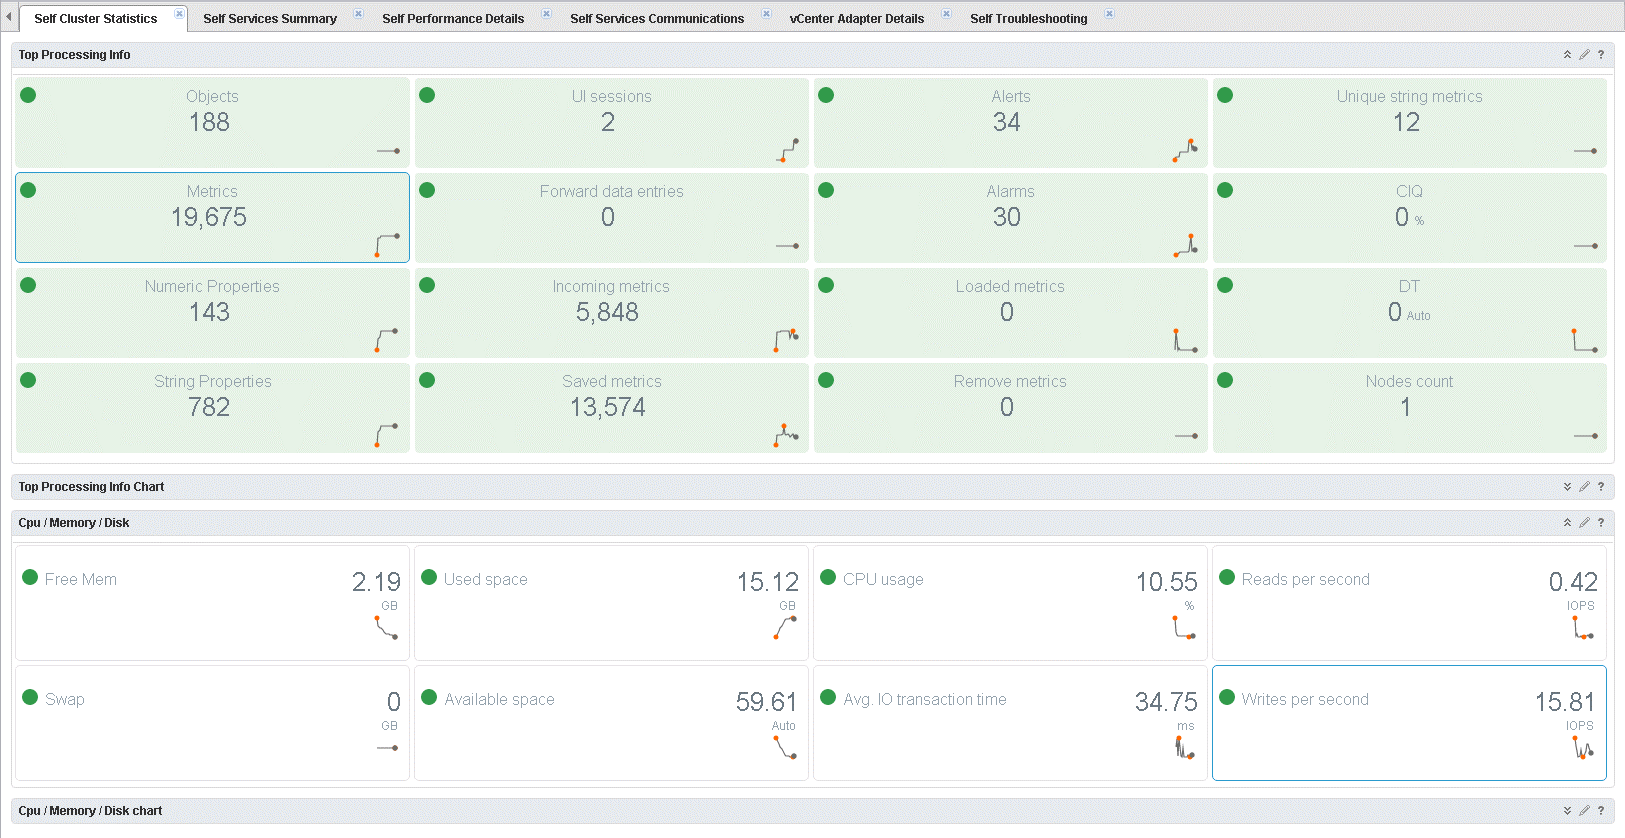
Self Cluster Statistics
Here is the first dashboard, which we will have a look at. As the name suggests, the dashboard shows statistics about the vRops cluster itself. The dashboard itself contains four widgets. “Top Processing Info” and “Cpu / Memory / Disk” which both shows statistics and status of the giving metric being monitored. Below each of the two widgets are a widget, which can be used to get a better look at the data provided via graphs. You can imagine just how useful this can be. It could be used for sizing of vRops or see if the dynamic threshold job is running and how far it is. Just to name a few. Not to talk at but the metrics for the usage of the vRops cluster. Metrics like “free mem”, “avg. IO transaction time” and IOPS are very useful in making sure your vRops environment is running as smooth as butter. If you want to know more you need to go have a look at it yourself.
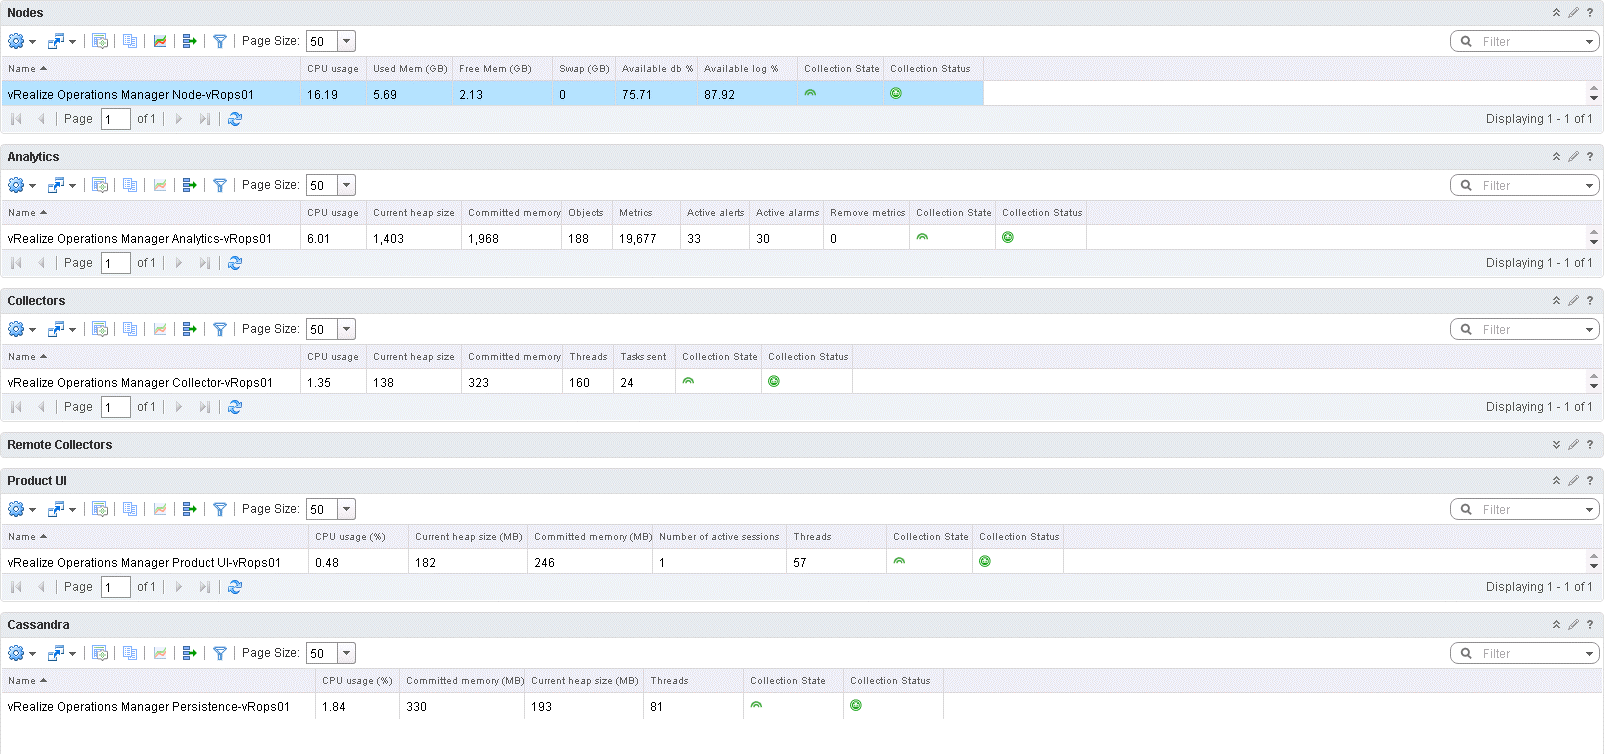
Self Services Summary
Now it is time to get even more insight into the vRops cluster. This time we dig a little deeper and look at the services running in the vRops cluster. Besides the services, the first widget in the dashboard shows utilization, state and status of each vRops node. The same can then be seen for all services needed for the vRops cluster to run. The old self health dashboard was mainly based on heat maps and the coloring of the objects in the heat map would indicate if there were a problem. Not that the old dashboard did not provide good information, this one just do it in a much nicer way if you ask me. However, this does require more knowledge then the easy to understand color-coding.
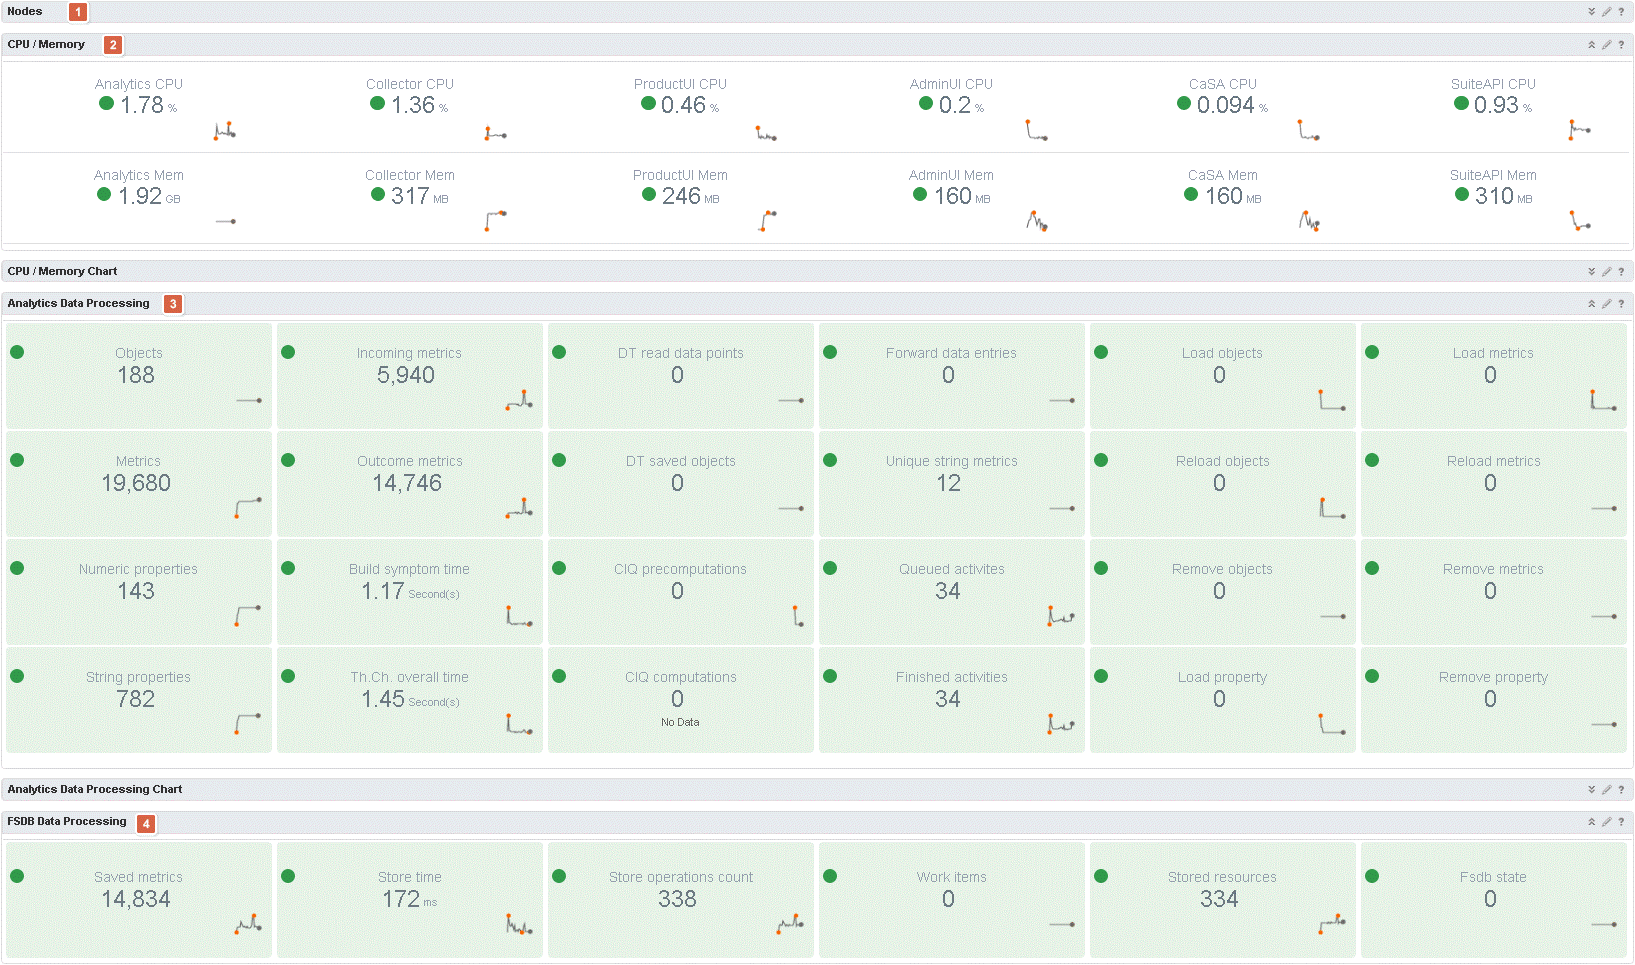
Self Performance Details
Just look at the dashboard it’s an insane amount of data the vRops team has been able to fit in here. At first glance, this dashboard looks like the cluster statistics and summary dashboards crammed together. However, do not be fooled this dashboard holds much more and deeper insight into the vRops environment. Nodes (1) provide information similar to the Nodes widget of the summary dashboard. A quick overview of the nodes and each nodes utilization. One could think that the “CPU / Memory” (2) widget would be similar to one of the before mentioned. Well that not quite right. Here CPU and Memory is referred to each of the services running on the vRops node. Again, clicking one of the metrics will draw a graph in the widget below, which is not visible here. The same layout is used for the two next widgets (3) (4). The Analytics Data Processing widget (3) is all about the analytics process of vRops. The last widget (4) does the same for the FSDB. A very neat way of seeing of the processed are running as expected.
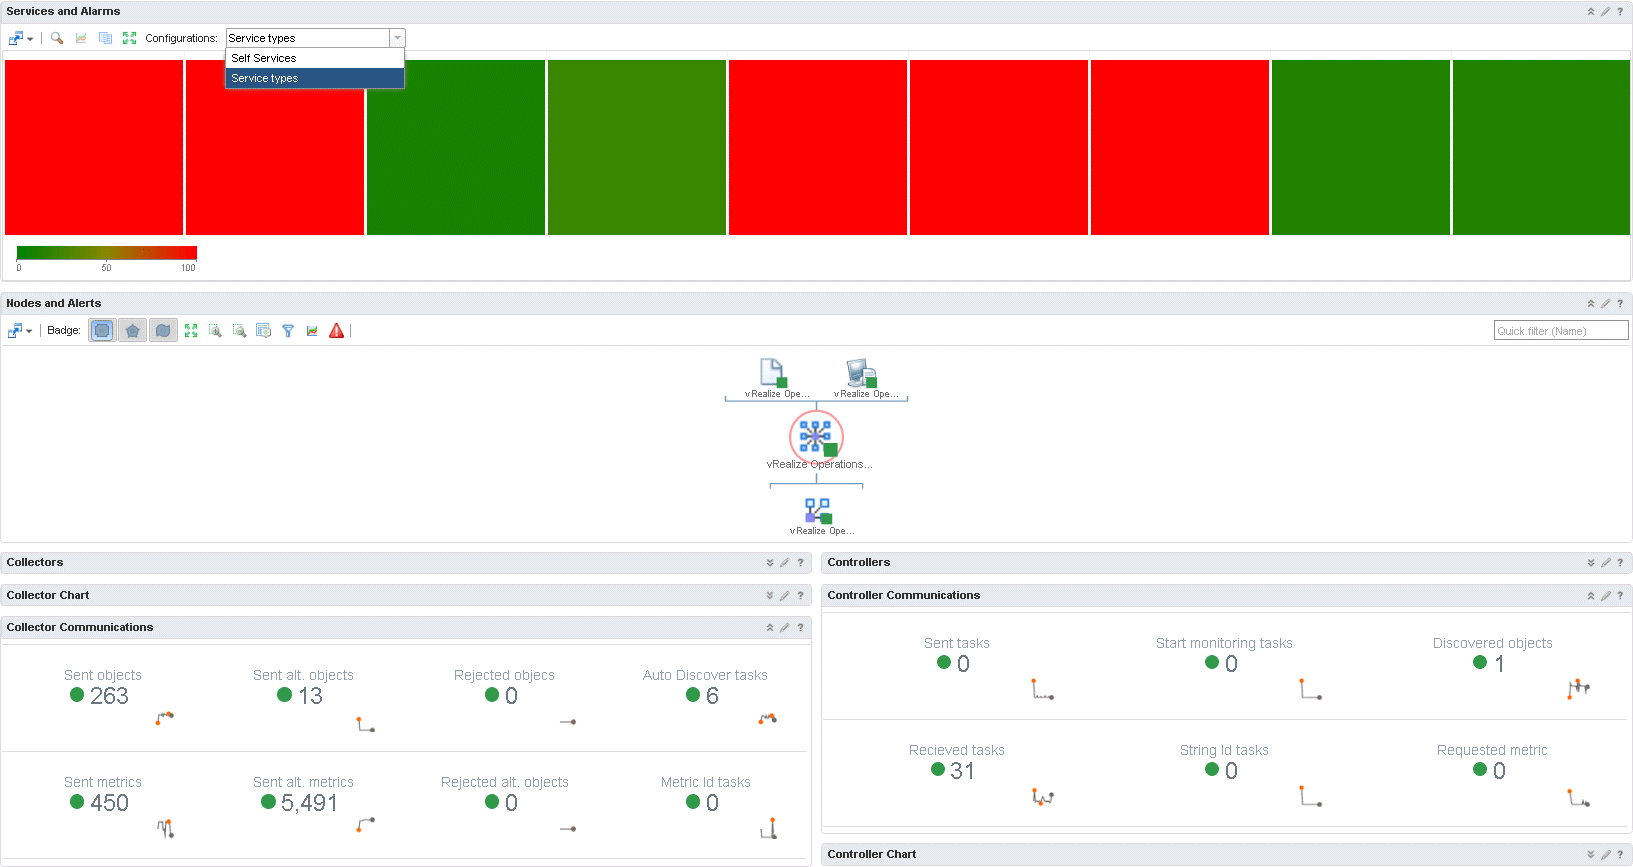
Self Services Communications
Next up is communications. First of a heat map, the force here is how easy they are to read. Note the drop down box. You can choose if you want to see self services or by service type. The environment I am using for showing these dashboards are a demo environment, therefore it only has one node. It makes the “Nodes and Alerts” widget a little boring to look at. What you see here is an overview of the environment. Everything below that has to do with communications metrics. Again, a great job has been done to make the widget easily readable.
vCenter Adapter Details
If you have been counting this is the fifth and second to last dashboard. So hang on almost there. Again, this seems a little misplaced in my small playground of a vRops installation. I hope you can still see the advantages of this dashboard. In order to populate the second and third widget you need to start by selecting a vCenter adapter. I only got one. At a glance, it is easy to see the number of metrics etc. being collected as well as the time it takes to collect these values. Now it is easy to asses where the load comes from and how well the adapter is doing.

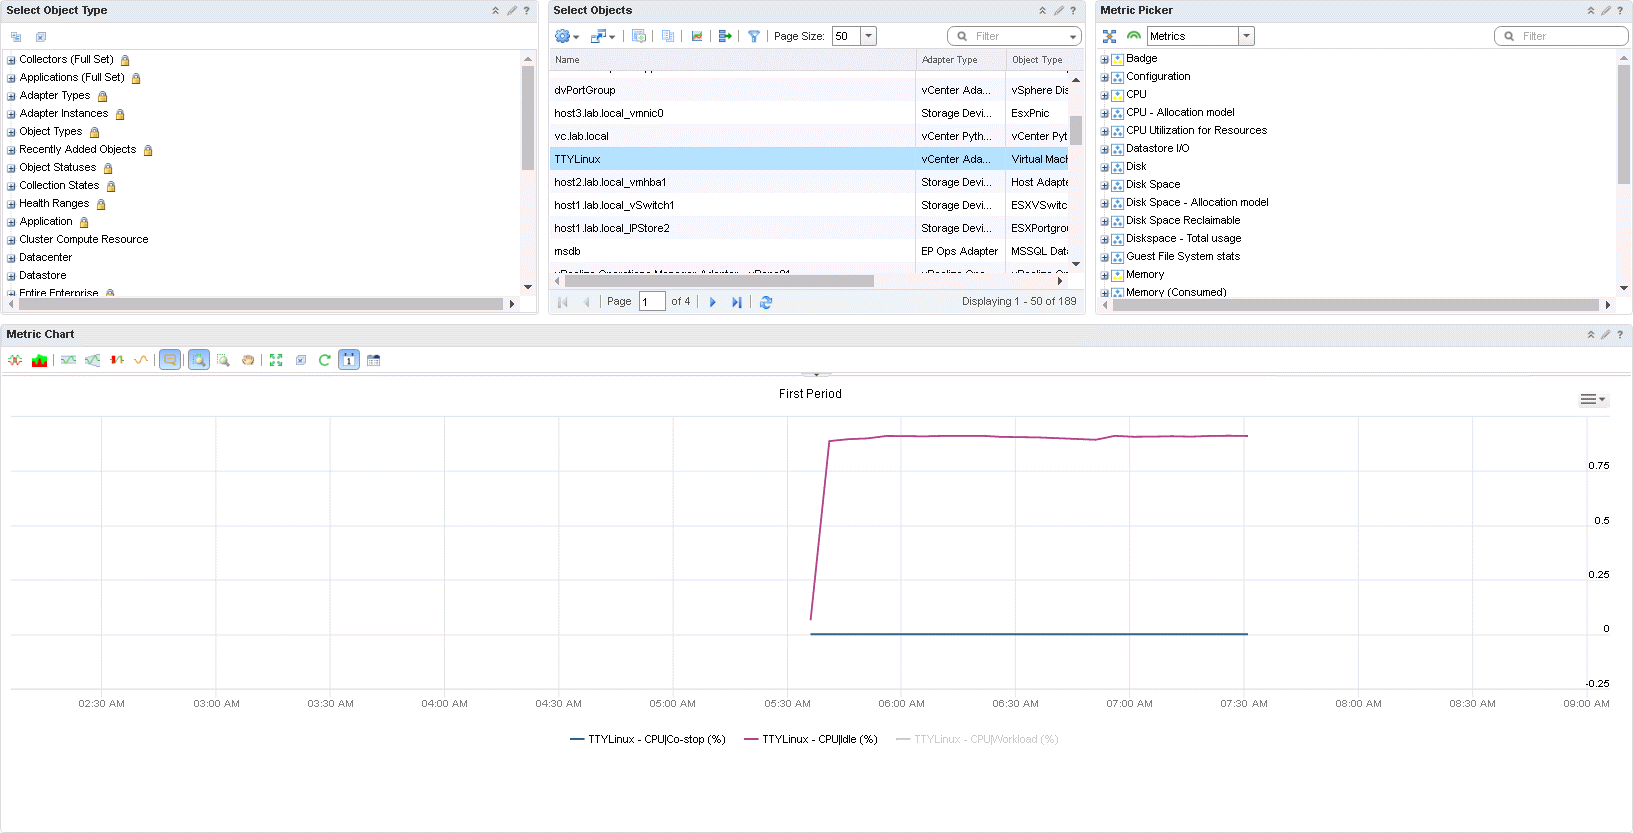
Self Troubleshooting
You made it. All the way to the last dashboard. I have not had time to play with this. So all I can offer you is what you see. From left to right. Start by filtering, then selecting the object in question and lastly select the metrics you want to display. All the metrics are going to be drawn in one view in the metric chart.
SDDC Health Dashboard
The SDDC Health Dashboard is not a new dashboard, which is backed with the release of vRops 6.3. It is a new management pack, which can be downloaded from solutions exchange. The management pack does require vRops 6.3. You can download it from solution exchange: https://solutionexchange.vmware.com/store/products/vmware-sddc-health-solution?src=vmw_so_vex_mryom_838
As always, the release notes and user guide can be found under the resources tab, again on solutions exchange.
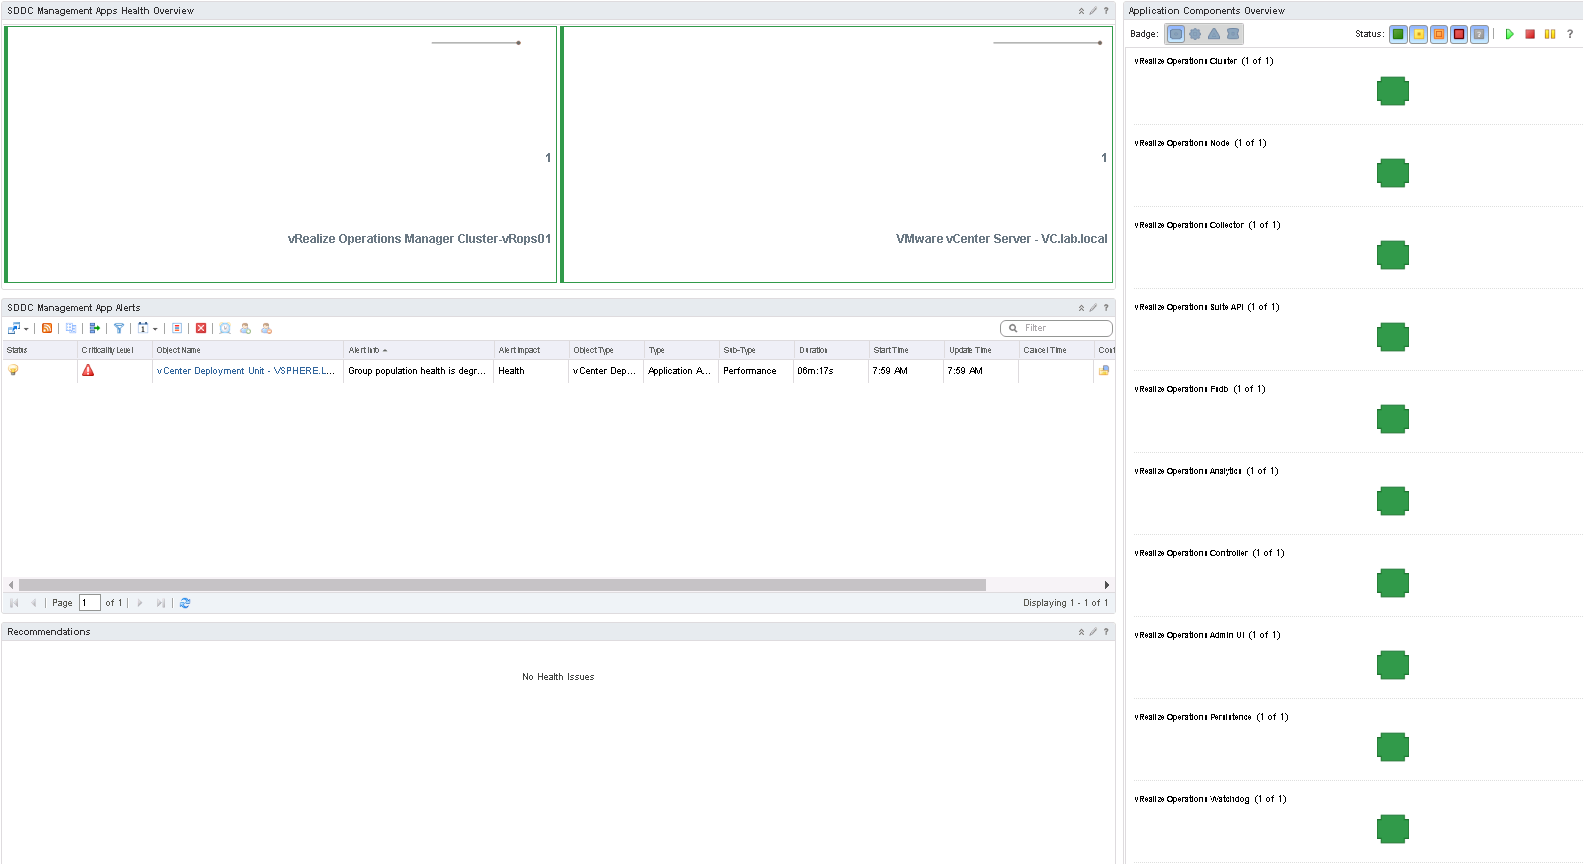
Now let us have a look at the new dashboard. Once the management pack has been installed, the dashboard can be found in menu under Home. The SDDC Health dashboard has four widgets. Starting from the top health can be seen for the two services in this environment. The applications are clearly color-coded, both green so that is good. Clicking on an application in the SDDC Management Apps Health Overview, give you the status of each of the services running in the application, as well as the status of each component of the application. As the application is green, so is all the components. The last two widgets is alerts and recommendations for the applications. In the alerts widget, there is a single alert on the vCenter application, stating that the health is degraded. As this environment are a playground of mine, I simply refreshed the dashboard and the alert was gone. It was simply pointing to the fact that not all components where up and running as fast as vRops started it monitoring of the environment. There you have it. A way to monitor SDDC applications in the VMware software stack.
Widgets
Creating dashboard in the previous versions of vRops has always felt a little old school. Some of the widgets could use some touch-up and the widget layout was very locked down. vRops 6.3 brings a lot of good stuff to this area.
You are not bound to a certain location. The next thing you will notice is that you can now also resize the widgets, as you like. Now you have the ability to have small and large widget next to each other. Widgets do not have to share the space equally anymore. This makes for a much better look and feel of the dashboards. As you, get a lot more control on to how your dashboard design can be implemented.
As it should be apparent by the screenshot above. Widgets can be pretty much any size you want and anywhere you want. Definitely a useful feature, which will help you a lot when designing a new dashboard.
The way to resize a widget is to drag from the lower right (1).
As you can see in the first screenshot, resizing works for both width and lengths. Any widget you can have resized to the size you should wish.
UX/UI improvements
There are a few areas where there are notable enhancement to the user experience and the user interface. These are heat maps and widgets, which I would like to highlight. The heat map, there are a few new features worth noting. Zooming into groups of objects and facelift of the widget. The facelift includes the ability to run the mouse cursor over (1), which highlights what parts of the widget the error corresponds to. What you see below is the mouse cursor, which are pointing to the last part of (1). With the number, 18 below it. That makes the first part of the data on the widget, standout and the two other parts of this heat map, is being put into the background.

Besides the changes made above a few widgets seems to have been given a few graphical changes, to make the feel and look of vRops more modern. These are all minor changes to the graphical interface, and I welcome them.
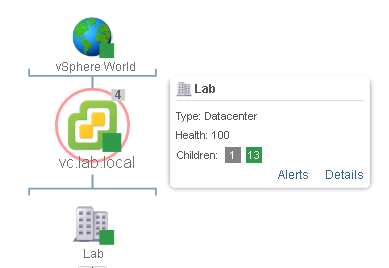
There is one UI update that I would like to share more details about with you. Whenever I’m in troubleshooting mode, it usually at some point end up on the “All metrics” tabs of the object. For as long as I can remember I have always hidden the graphical representation of the object(s) I was troubleshooting. Not anymore. It has gotten a great update both UI wish, but also UX wish. Now if you hover the mouse over one of the objects you will get some more insight into the object and if there are any issues with it. What you get is a health score of the object and the status of the objects children’s. As can be seen in the constructed screenshot below. There is a total of 14 children’s. 13 of the are green and one object is unknown. This helps us to faster understand which objects are having problems in the environment. The lastly two buttons have been added. Alerts, which brings you to the alerts tab and details, which lets you, jump to that object and start troubleshooting from there.
Updates to Workload Utilization dashboard
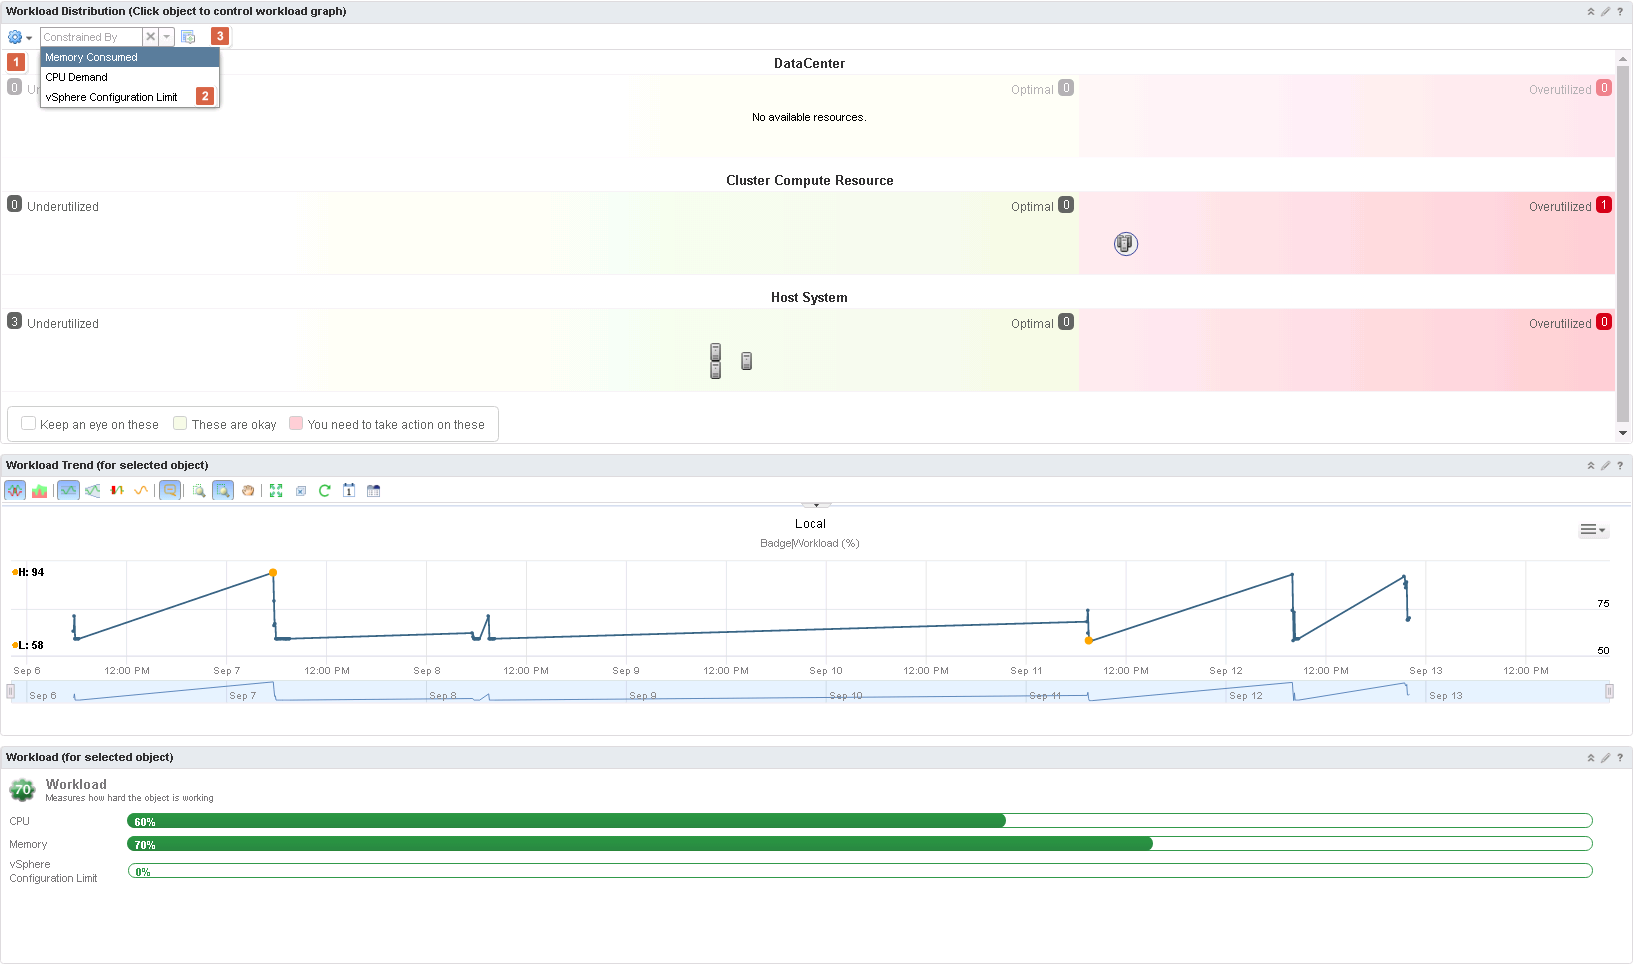
The workload utilization dashboard is not something new in this release. It’s a dashboard, which I have grown very fund of. Especially in large environments. The simplicity to the story it tells, and how easy it is to understand what need to be done, is very powerful. In vRops 6.3 a few enhancements have been made. To the widget workload distribution which is used by the workload utilization dashboard.
There are three options. By CPU, by memory or by vSphere configuration limit. Personally, I really like that vSphere configuration limit(s) get that much exposure. It is one of those issues that are really annoying to bump into. As always if you want the default filter back, just click the cross (2). The last option (3) is to reset the widget.
That concludes the all about widgets section. Now onwards to talk about Log Insight integration.
vRops 6.3 and Log Insight 3.6 enhancements
vRops and Log Insight have a great integration which is beneficial to both parties. There are three key areas in this release where vRops and Log Insight joins even better.
- Enhanced Alerting
- Auto Cancel Alerts
- Use VIP
Enhanced alerting means that you now get more data with the alerts. Emails alerts has always been a bit ahead. Now both are on par. Which is nice to see and very useful.
Prior to this release vRops would use the Log Insight master node to make connection. This has now been changed. From now on if a virtual IP address has been configured, then it will be used. This is more of an alignment with reality, as I think most people will prefer to use the highly available IP address, then the one that is not so much.
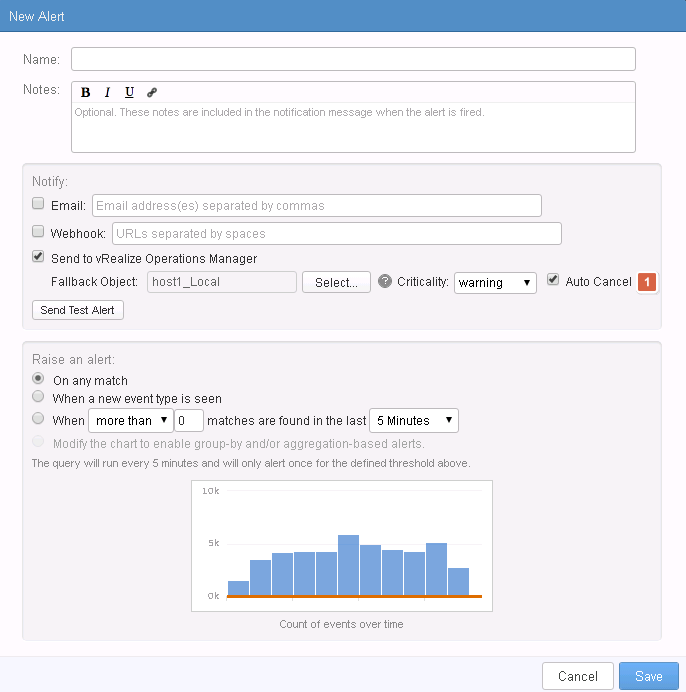
That mean it is time for the last enhancement between vRops and Log Insight. When creating an alert in Log Insight you have the ability to send the alert to vRops. What that happens is that an alert is created in vRops. These alerts to not auto clear when the alert problem has been fixed or vanished. This could mean that quite a few alerts would be created, which needed manual intervention to cancel them. Now when creating an alert in Log Insight you have the ability to auto cancel the alert. All you have to do is check mark the auto cancel (1), checkbox and the alert will be cleared in vRops after ten minutes.
Maintenance schedule
As I stated in the beginning of this blog. Prior maintenance schedules are not compatible with vRops 6.3. This means that the maintenance schedules will be gone when upgrading from a version prior to 6.2.0a. Please before you, upgrade note how and to what your maintenance schedules have been created. As you will have to recreate them again yourself.
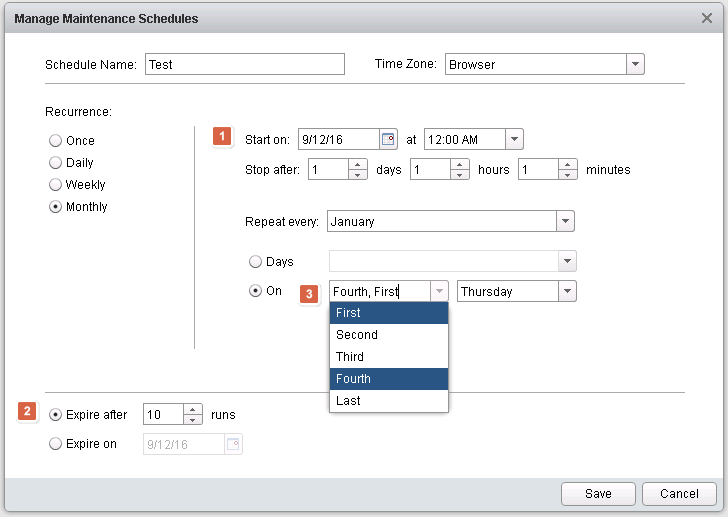
The reason for all this is that there are some nice enhancements to the maintenance schedule. New in this release is the ability to specify start date and an end (1), together with time. This makes it easier to specify short periods of maintenance. Add to that the possibility to specify how many times (2) this maintenance schedule should run and you should be able to for fill most requirements for maintenance.
Please note that it is also possible to select multiple objects from dropdown boxes (3)
Metrics
The number of metrics for which data get collected has been declining over a number of vRops releases and this release is no exception. There have been cut some metrics. I havn’t seen a complete list of what has been cut, but just from looking at the metrics being collected for a VM it seems that the capacity remaining metrics based on profiles have gone. In total it seems around 100+ metric have gone. It not all “bad news” if you will. Some new metrics has also been added. There are new metrics from inside the guest. Again, no complete list has been released. From what I have deducted, this should be the list of new arrivals.
Guest|Active File Cache Memory (KB)
Guest|Context Swap Rate per second
Guest|Free Memory (KB)
Guest|Huge Page Size (KB)
Guest|Needed Memory (KB)
Guest|Page In Rate per second
Guest|Page Out Rate per second
Guest|Page Size (KB)
Guest|Physically Usable Memory (KB)
Guest|Remaning Swap Space (KB)
Guest|Total Huge Pages
There is a great potential in putting these metrics to good use. Moreover, kill some discussion with good knowledge, before they get out of hand.
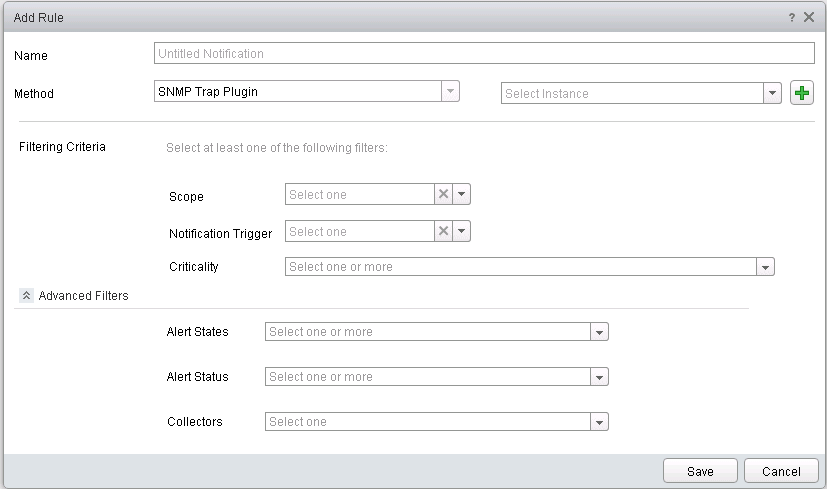
Notifications filtering
I know this is a request many of you have been waiting for. Until now all SNMP trap have been sent to its destination and the destination have had to filter on what traps to receive, or you have had to put in between the source and destination a solution which could filter and then forward the trap to its final destination. Behold, in vRops 6.3 filtering is now possible making the above solutions a thing of the past.
It’s not just SNMP trap which has been added to notifications, the log file plugin gets the same treatment. So now, like with emails you define outbound settings and then you define a notification rule.

Super Metric enhancements
Personally, I have been waiting for this update. With the introduction of vRops 6.3, new super metrics operators are now available! What this means is that now it is even easier to transform or create new metrics from the already collected metrics. New operators are as following:
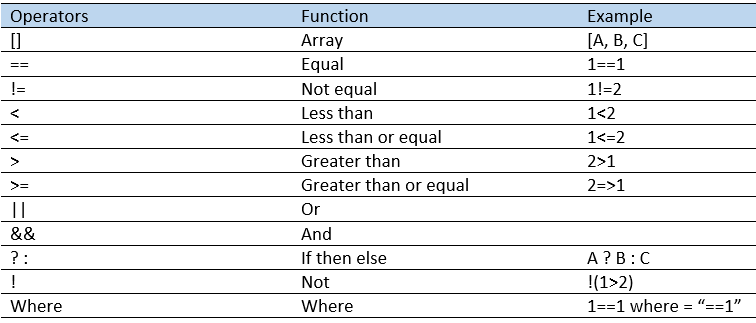
Before it was just regular math operators, add, subtract etc. By adding these new operators, much better data manipulation is possible and it is possible to compare and act upon the data at hand. This opens up the changes of getting just the data you need. One use case could be to measure OS uptime, which has not been possible until now. I guess only time will tell if we can get a lot more done with these new super metrics operators.
Two other neat features are where clause and alias’s. This looks a lot like sql-t statements. You can create an alias to a metric by appending “as [alias]”. This can save you save time and make the super metric statements easier to read. The where clause works similar to a sql-t where clause. It is a way to only get data or do some task if the where statement is true. Have not had time to play with this, let see if I can find the time in another blog post.
Views
This is another feature I have been looking forward to for some time now. I work with some financial institutions and they did not like the way reports where done I vRops. What they wanted was a monthly report, meaning no matter when the report was run in vRops they wanted it to be for the last hole month or quarter. This was not exactly how this where in vRops, until now. I had a chat with the head of the vRops team about this feature request and less than 24 hours later a markup of how the team envisioned the enhancement was in my inbox. For that and for getting the feature in so fast, I would like to say thank you to the vRops team. Now what does the enhancement look like.
There are two things in here, which are new. The absolute date range (1), which lets you specify the absolute time for this view and (2) the ability to understand the selections made. As it can be seen, I have chosen one month back (1) and I can verify my selection by looking at the “currently selected data range” (2). This is a very nice way the feature request ended up being implemented. Great job vRops team!
vSphere Distributed Resource Scheduler (DRS) Integration
I have already touched on this in the dashboard section when while about the “vSphere DRS Cluster Settings dashboard”. New in vRops 6.3 is the ability to change DRS cluster settings directly from vRops. I can be done from the vSphere DRS Cluster settings dashboard. Selecting a cluster from the dashboard and the icon which can be seen in the top left corner of the screenshot below, brings up the set DRS automation interface. As can be seen in from the dropdown menu. DRS options can be selected. When the correct setting has been selected, click the “Begin Action” button, to kick off the change.
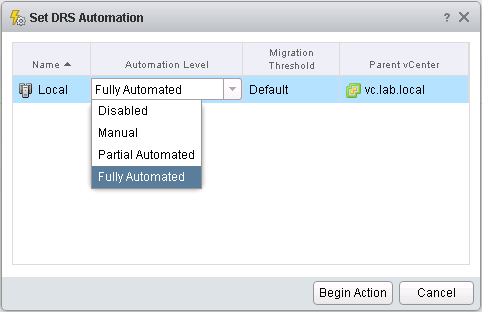
In order for this to work, you have to have the vCenter actions enabled for doing automated tasks like this.
vSphere 6.0 Hardening Guide
This is another major step forward for vRops. Up until now, only vSphere 5.5 hardening guide could be supported. That said it was really only partial supported has many checks could not be automated or queried from outside. With vRops 6.3 this all changes, mostly for the better. vSphere 5.5 hardening guide seems to be stuck where it is, another good reason to upgrade. As vSphere, hardening guide now supports vSphere 6.0. It does seem to be all of the checks in the vSphere hardening guide, which is now supported with vRops 6.3. This means that it is now possible to set up monitoring based on your security requirements and have vRops alert you whenever one of the rules have been broken.
To make it even easier to get started both the hardening guide and vRops uses the concept of Risk Profiles. There are three risk profiles, one is the strictest and three is the most laxed. I have heard the risk profiles descripted as the following criteria’s for use.
Risk Profile 1 – Used for top-secret, paranoid and government organization.
Risk Profile 2 – Use cases would be banks, strict compliance environments and sensitive information.
Risk Profile 3 – The least compliance requirements for environments. Should get implemented by all, as a lowest default for a vSphere environment.
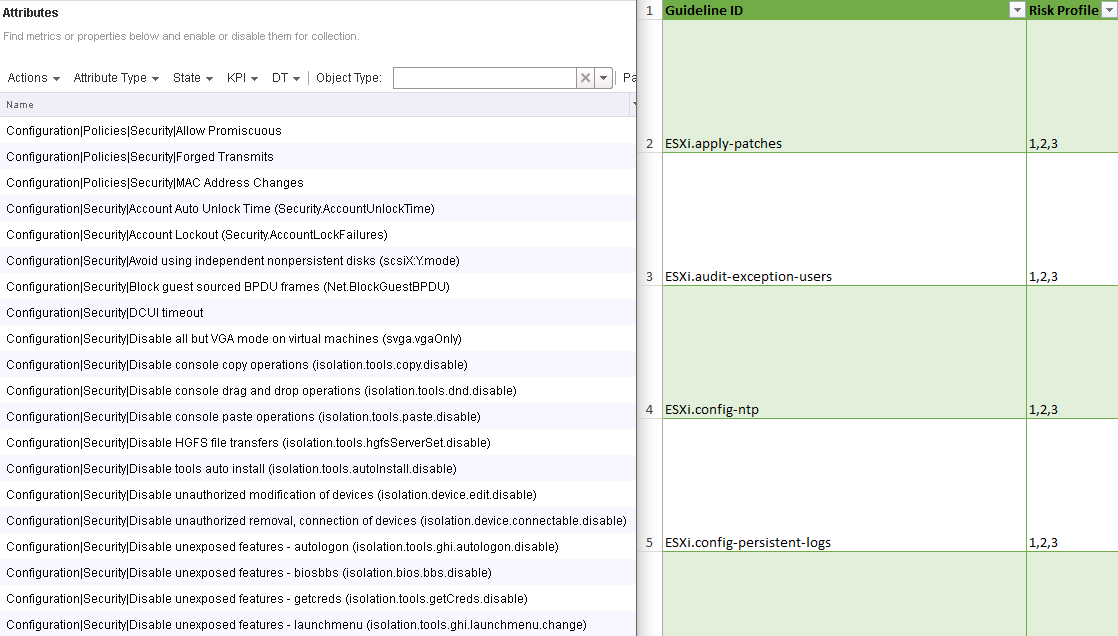
As both vRops and the hardening guide uses the term Risk Profile, it is now dead easy to see what goes into every risk profile and if it matches your compliance requirements. As always if you need stricter then what is in the policy (Risk Profiles are created as policies), you can simply enable it in your policy. If you have different environments with the different requirement for compliance, you just have to setup the correct policy for that part of the environment and you are good to go.
This is extremely helpful and could save you days trying to find a good way to check if your environment complies with your business requirements.
As if, none of this was enough. There is also a report, which can be run or scheduled that will show you which parts are non-compliant.
The latest vSphere hardening guides is to be found at http://www.vmware.com/security/hardening-guides.html?src=vmw_so_vex_mryom_838
License alignment
There is two quite cool alignments in vRops 6.3. First it is now possible to license vRops Standard editions based on per CPU licensing.
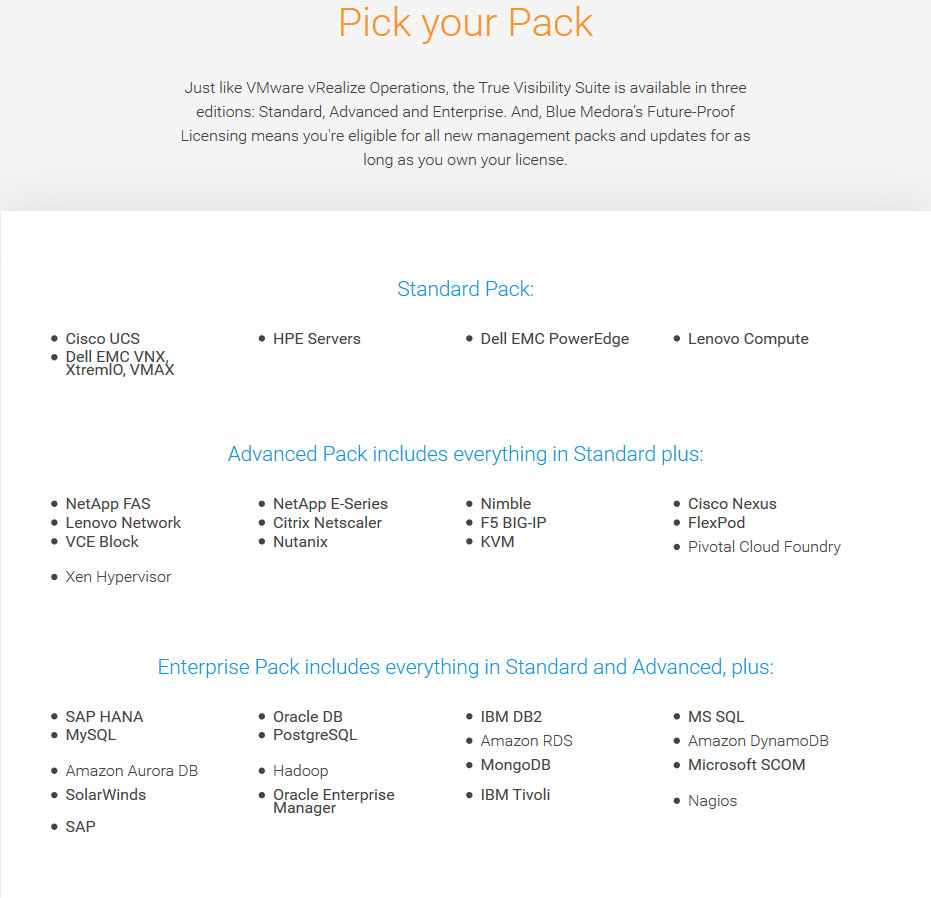
The other, which is a bit more intriguing, is bundling of management packs. There are some management packs both from VMware and from third party, which can be downloaded for free at the solutions exchange. There is also those who cost you. The biggest company of them is Blue Medora. Prior to this, you would buy the management pack you needed. That has changed now. To align with the vRops editions Blue Medora has change the way they sale management packs and instead of selling one at a time, they have now been bundled in to three bundle. As you can see, they fit perfectly within the three vRops editions.
Solutions enhancements
If few changes have also been made to the solutions. There are changes, which I as a consultant are really happy about. What often happens when things go fast is that the default options are selected for the lack of better knowledge or understanding of the impact on how vRops does it’s monitoring. New in vRops 6.3 is the ability to answer those questions again if corrections are needed. By clicking the “Define Monitoring Goals” (1), you get to correct the answer first given. A new button has also been added “Reset Default Content” (2). Not sure, of the use case, but what it does, is that it resets all objects, which comes with the management pack. These are objects like, alerts, symptoms, dashboard etc.
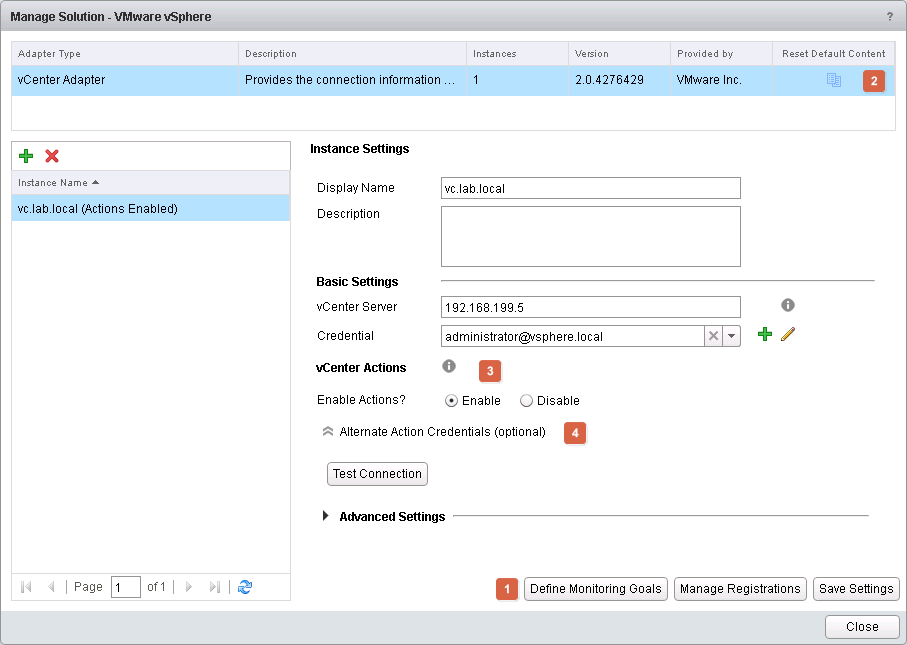
Also, new in this release is the absence of the Python framework adapter. This has now been nicely integrated into the vSphere solutions. Where you now have the ability to enable vCenter actions (3) and provide an alternative set of credentials (4) for the vCenter actions to be executed.
That concludes this vRops 6.3 release. Quite a massive set of changes if you ask me. I am impressed with the amount of features and the quality there goes into them. vRops is a long way, away from being dead! One of the products that take monitoring to new highs and takes care of the entire datacenter in the process.