
The network component and the troubleshooting that sometimes we need to do represents a big factor on all cloud customers, not matter if you are using Azure, AWS, Office 365 or any other. If you don’t have control over the network and/or you are not capable of identifying issues root causes, then there’s most likely the cloud experience it’s not going to be a good one. Microsoft has that clear and is now offering a new tool to assist customers: Azure Network Watcher.
Azure Network Watcher is available as a preview for the moment and in selected Azure regions: US West Central, US North Central, and US West. To access the preview, you need to follow the steps in this guideline: “Create an Azure Network Watcher instance” and “Register the preview capability”.
What can I do with Azure Network Watcher?
Azure Network Watcher offers Azure admins tremendous logging and diagnostic capabilities in their environment, from simplifying the network topology views for your applications or analyzing packets between virtual machines in Azure.
Here’s a complete list of capabilities and features available with Azure Network Watcher:
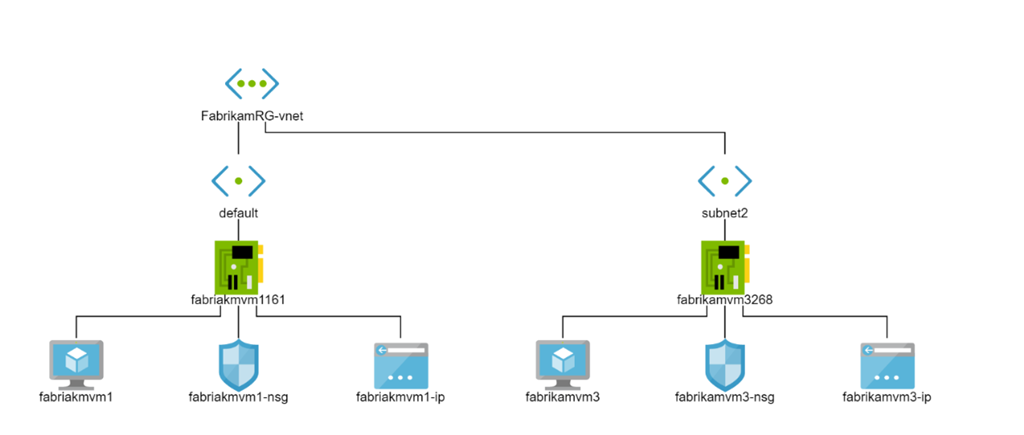
- Topology: Automated and easy way to visualize the network topology of your applications in order to facilitate the troubleshooting.
- IP flow verify: Easy way to confirm reachability between virtual machines, you can combine source and destination IP, with ports and protocols to validate if the connection is allowed or denied.
- Next hop: This feature will allow you to detect any misconfiguration in network routing between virtual machines.
- Security Group view: Great feature to audit network vulnerabilities. With Security Group view, you can retrieve the configured Network Security Group and security rules, as well as the effective security rules.

- Packet capture: This feature will let you analyze packets received from and to virtual machines (including Windows and Linux), that match with specific criteria like a source or destination port or a byte offset from the start of the packet.
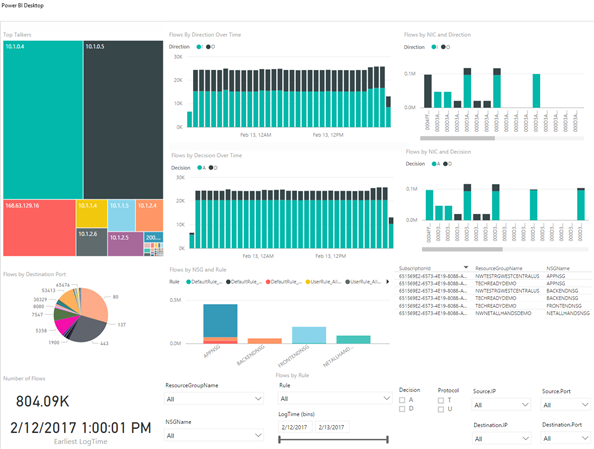
- NSG flow logs: Flow data is a critical component for diagnosing and validating your Network Security Group configurations. You can now enable logging of NSG flow data that is allowed or denied per Network Security Group setting to help meet these needs.
- Network Subscription limits: Analyze the usage of network resources against the limits in your subscription.
- Diagnostic logs: Ability to configure diagnostic logs for all the network resources in a group from a single pane.
Azure Network Watcher capabilities are accessible via Portal, PowerShell, CLI, Rest API, and SDK.
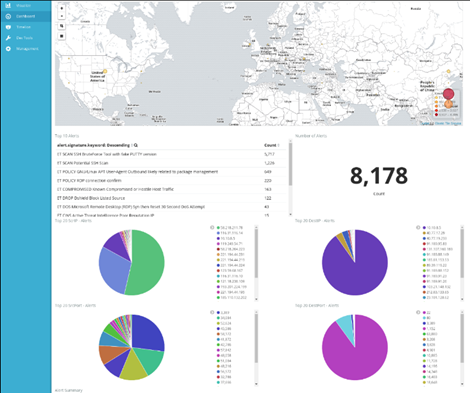
Microsoft is already working with partners to extend functionalities and support of the Azure Network Watcher, including some Open Source tools CapAnalysis, Suricata and the Elastic Stack (Elasticsearch, Logstash, and Kibana).
The following snapshot is a sample dashboard highlighting network intrusion – integrating Network Watcher, Suricata, and the Elastic Stack:
Azure Network Watcher will have no additional cost for Azure subscriptions, which is a great news for customers since they won’t have to look through networking experts for trying to troubleshoot each problem.