
Monitoring Proxmox environment is an essential administrative practice for maintaining a healthy and fully functional system.
It allows administrators to proactively identify and fix issues before they lead to service disruptions.
This guide explains how to monitor Proxmox VE using InfluxDB and Grafana on an Ubuntu system – from installation to a working dashboard.

Why Monitor Proxmox VE?
Proxmox VE doesn’t include a full monitoring suite by default.
Connecting it with InfluxDB (for metrics storage) and Grafana (for visualization) gives administrators a clear, real-time view of CPU, memory, and disk usage across nodes and VMs.
Benefits include:
- Early detection of performance bottlenecks
- Centralized metrics for multiple nodes
- Custom dashboards for long-term trend analysis
Requirements
Before starting:
- Ubuntu 22.04 (or similar) system for running InfluxDB and Grafana
- Working Proxmox VE cluster with network access to the Ubuntu host
- Root or sudo privileges
Step 1. Install and Configure InfluxDB on Ubuntu
The first step is to ensure the Ubuntu system is up to date.
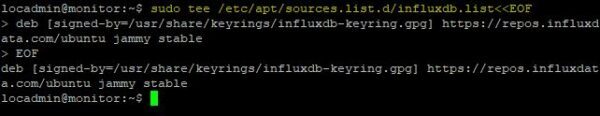
Add the InfluxDB repository
An APT repository is available for InfluxDB that simplify the installation procedure. Add the repository with the following command:
# sudo tee /etc/apt/sources.list.d/influxdb.list<<EOF
> deb [signed-by=/usr/share/keyrings/influxdb-keyring.gpg] https://repos.influxdata.com/ubuntu jammy stable
> EOF
Import the InfluxDB GPG key
# curl -fsSL https://repos.influxdata.com/influxdata-archive_compat.key|sudo gpg --dearmor -o /usr/share/keyrings/influxdb-keyring.gpg

Update the list of available packages
# sudo apt update
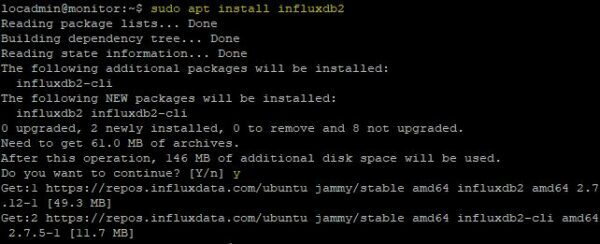
Run the following command to install InfluxDB
sudo apt install influxdb2
Start the InfluxDB service
# sudo systemctl start influxdb
![]()
Enable the service to start automatically on boot
# sudo systemctl enable influxdb
![]()
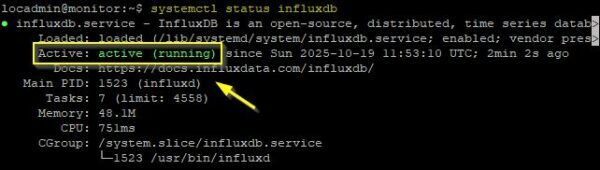
Check the service status to ensure the service is running correctly.
# systemctl status influxdb
Access the InfluxDB web interface
Now using your preferred browser navigate to http://<IP_Address>:8086. Click Get Started.

Follow the on-screen prompts to create an initial Username, Organization Name, and Bucket Name. When finished, click Continue.

Copy the displayed token to your clipboard by clicking the Copy to Clipboard button, as you will need it later.

Step 2. Connect Proxmox VE to InfluxDB
In your Proxmox web interface, select your cluster. Navigate to Metric Server, click Add, and choose InfluxDB.

Provide a Name, enter the IP address or hostname of the InfluxDB Server, and specify the Port and Protocol. Enter the Organization and Bucket names you configured earlier in InfluxDB and paste the token you copied. Click Create.

The new metric server will appear in the list.

Verify the connection by going back to the InfluxDB web interface and refresh the page. Click Return to Home Page.

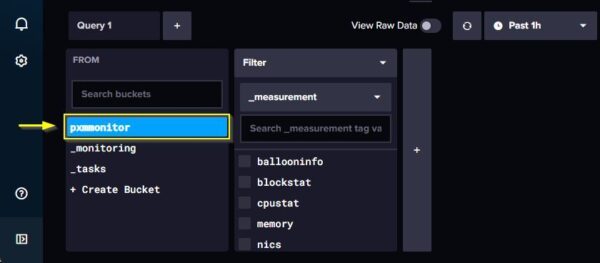
Click on Data Explorer icon.

At the bottom you will see the bucket created earlier.
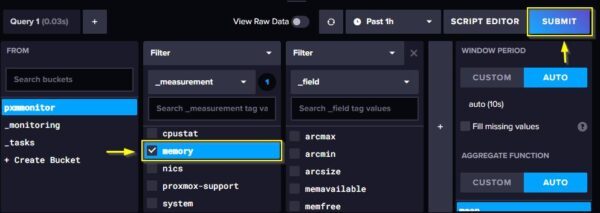
Select the created bucket and a metric to monitor (memory in the example). Click Submit.
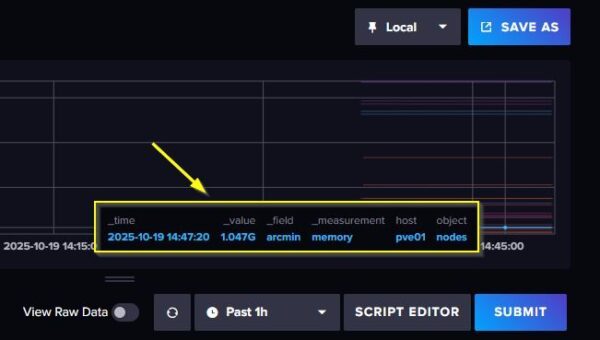
You can see data coming from your Proxmox server, confirming InfluxDB is working as expected.
Step 3. Install Grafana
Next step required for monitoring Proxmox is the installation of Grafana, which provides a powerful platform for visualizing metrics.
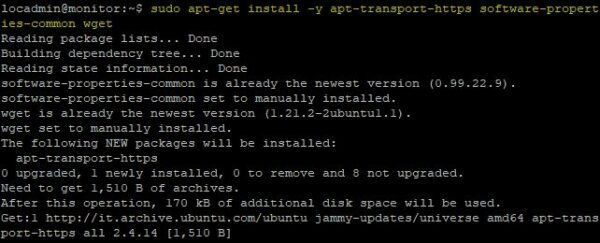
Install the prerequisite packages.
# sudo apt-get install -y apt-transport-https software-properties-common wget
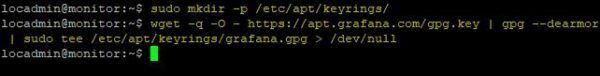
Import the GPG key.
# sudo mkdir -p /etc/apt/keyrings/
# wget -q -O - https://apt.grafana.com/gpg.key | gpg --dearmor | sudo tee /etc/apt/keyrings/grafana.gpg > /dev/null
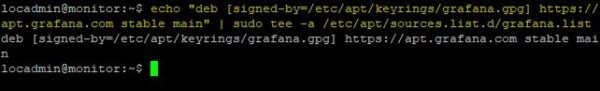
Add the Grafana repository.
# echo "deb [signed-by=/etc/apt/keyrings/grafana.gpg] https://apt.grafana.com stable main" | sudo tee -a /etc/apt/sources.list.d/grafana.list
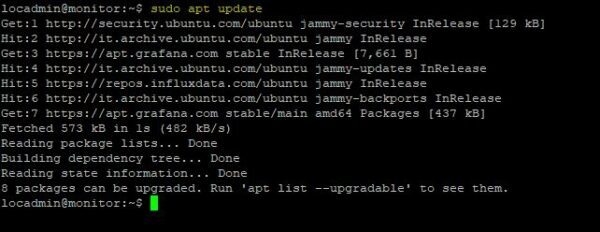
Update the list of available packages.
# sudo apt update
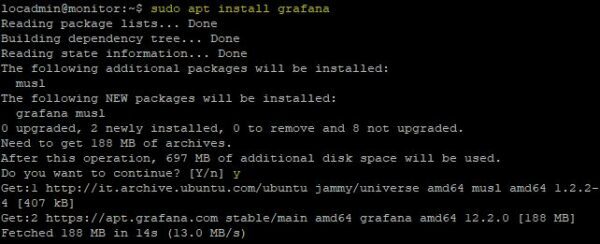
Install Grafana.
# sudo apt install grafana
Start the Grafana service.
# sudo systemctl start grafana-server
![]()
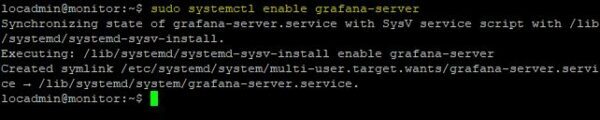
Enable the service to start automatically on boot.
# sudo systemctl enable grafana-server
Now using the preferred browser, navigate to http://<IP_Address>:3000. Enter the default credentials:
Username: admin
Password: admin
Click Log in.
![]()
You are prompted to change the password on the first login. Type the New Password and click Submit.

Step 4. Add InfluxDB as a Data Source in Grafana
In Grafana, go to Home > Connections > Data sources.

Click Add data source.

Select InfluxDB.

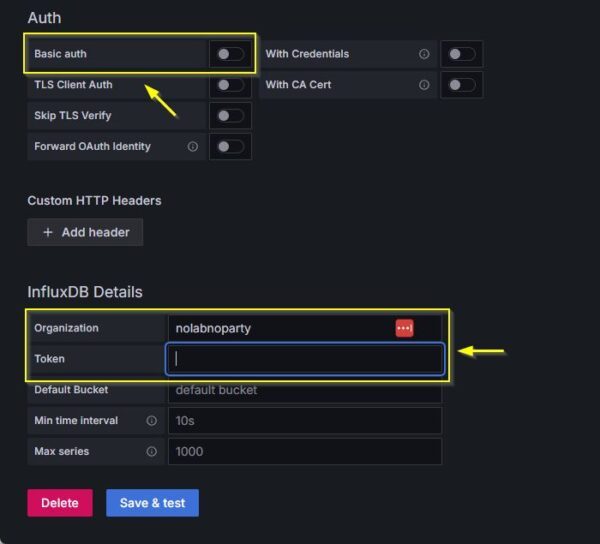
Select Flux as Query language and enter the correct URL in the HTTP section.

Scroll down and disable the Basic auth switch. Enter the Organization name and for the Token, you need to create a new one from the InfluxDB web interface.
Go back to the InfluxDB web interface and select arrow icon > API Tokens.
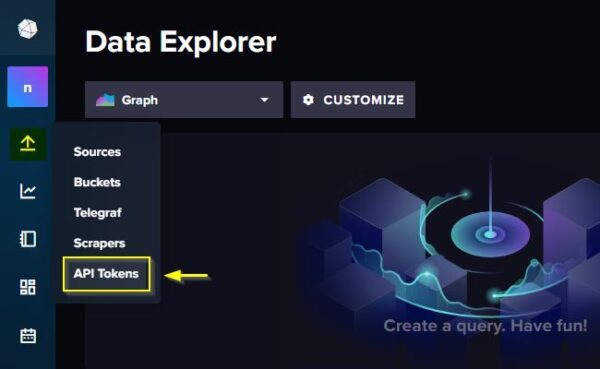
Since we need to create a specific token for Grafana, click Generate API Token and select Custom API Token.
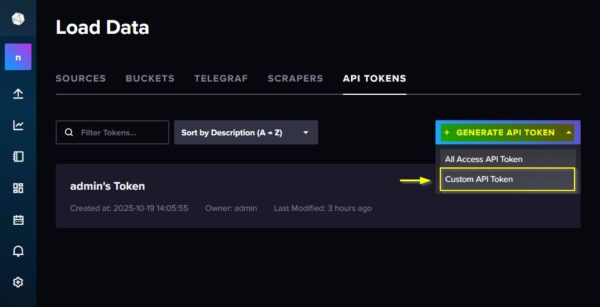
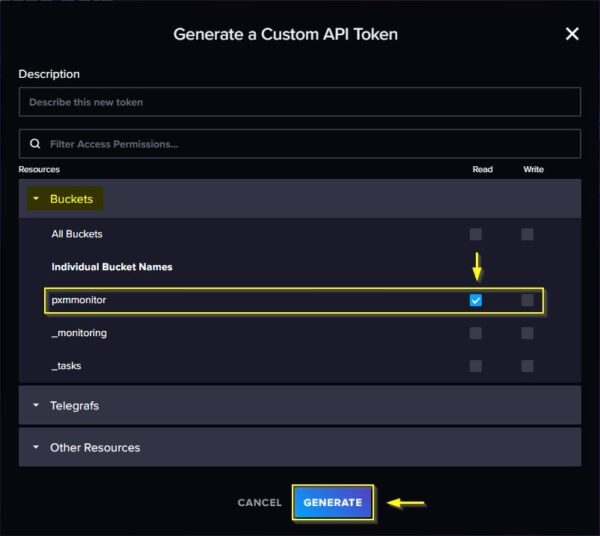
Expand Buckets and assign Read permission to the bucket previously configured. Click Generate.
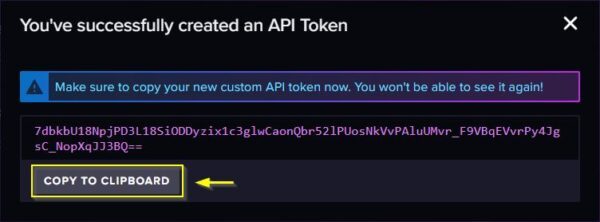
Click Copy to Clipboard to copy the generated Token.
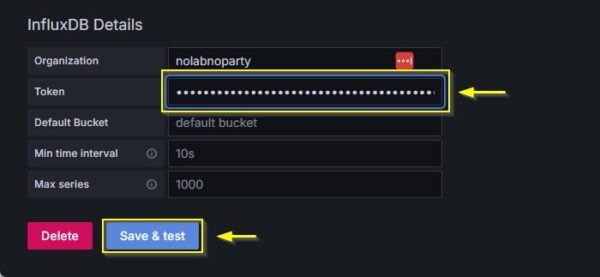
Return to the Grafana data source configuration and paste the copied Token. Click Save & test.
The test is completed successfully and everything works as expected.

Step 5. Import a Proxmox Dashboard in Grafana
To visualize the Proxmox metrics, you need to import a dashboard to Grafana.
Open your preferred browser and go to the Grafana Dashboards website and search for the Proxmox dashboard.
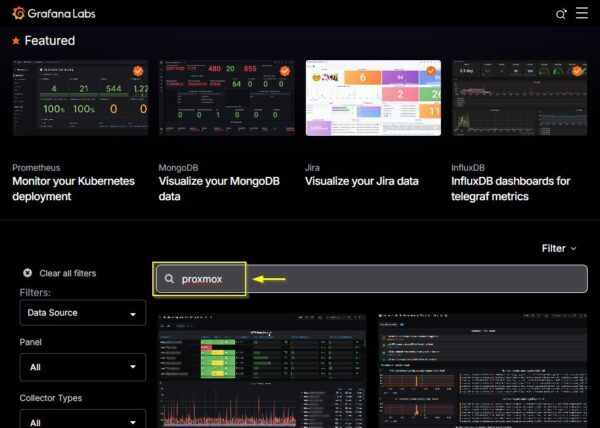
Select a Proxmox dashboard that is compatible with InfluxDB2.

Copy the ID number of the selected Dashboard.

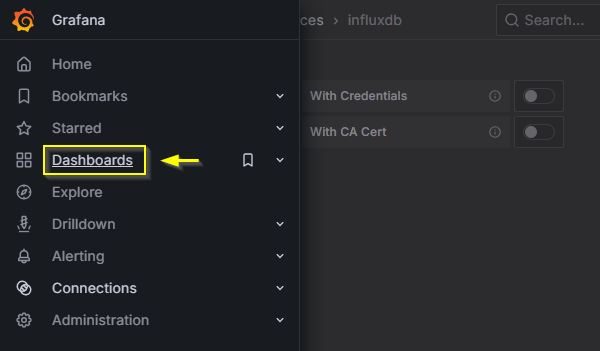
In the Grafana instance, select Home > Dashboards.
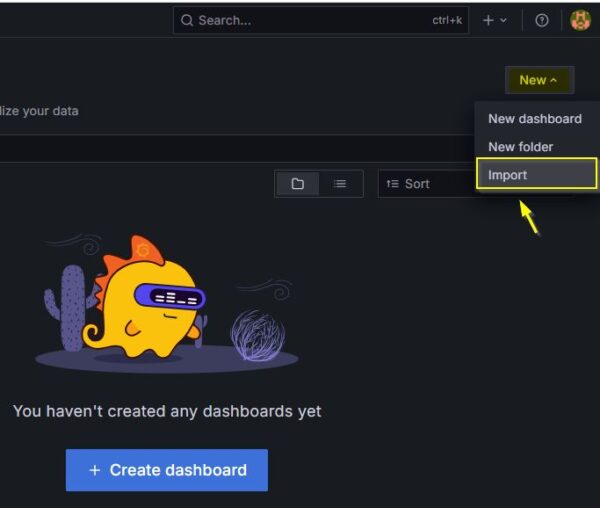
Click New and select Import.
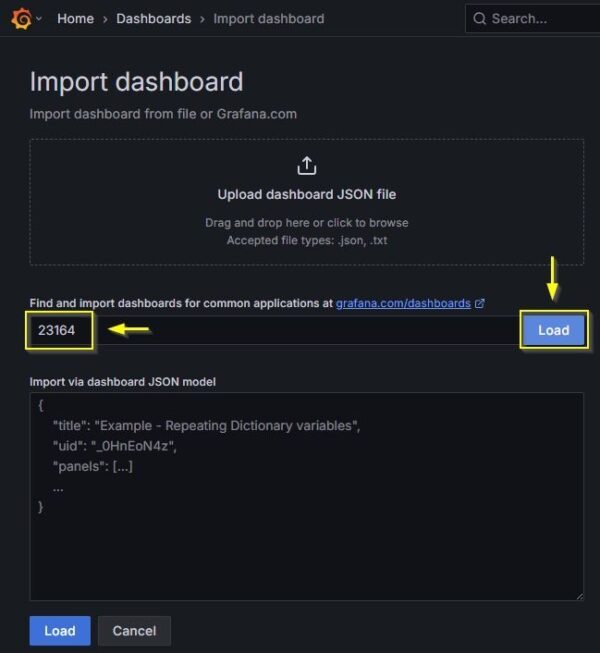
Paste the Dashboard ID and click Load.
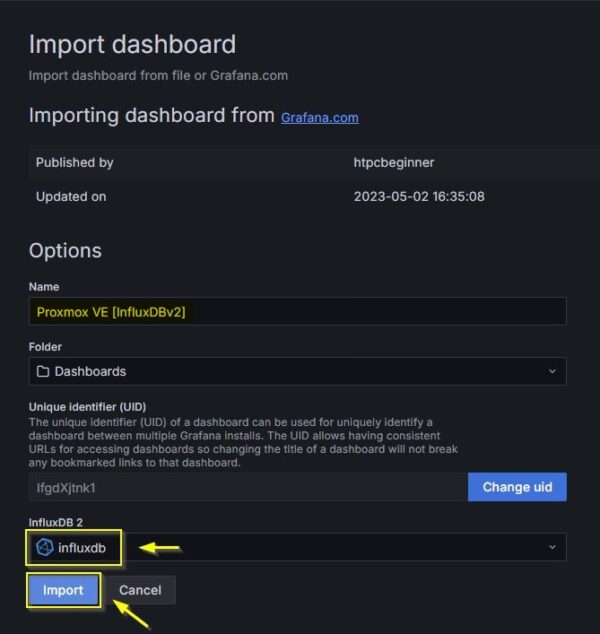
From the InfluxDB 2 drop-down menu, select influxdb data source and click Import.
The Dashboard is imported successfully, and metrics begins to be displayed.
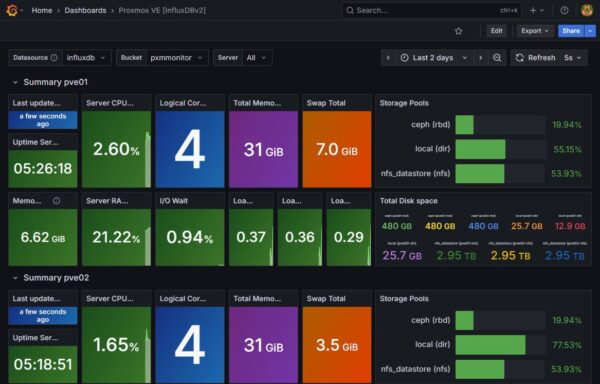
By monitoring Proxmox with this setup, administrators can ensure the correct functionality of their cluster and avoid dangerous issues that might otherwise go undetected.
Conclusion
With InfluxDB and Grafana, you can build a reliable monitoring system for Proxmox VE. It gives you real-time visibility into your cluster’s performance and helps prevent potential failures. Regular monitoring ensures your virtualization environment stays efficient, stable, and scalable.