
Introduction
Sooner or later, every system administrator finds the need to have some data transferred over the network. And, of course, every system administrator usually knows how this goes, all pros and cons, which aren’t many, to be fair. Since the 2000s, one of the few popular and widely used solutions for such operations is iSCSI, a protocol for storage networking. Due to the latency, enterprises tend to apply iSCSI as secondary block storage. Essentially, it means that iSCSI has been used when the situation requires good performance, but it’s not vital. Common sense dictates that under such circumstances critical applications in dire need of the fastest performance should be run, for example, on a physically separate storage network. At least, that’s how it used to be.
The NVMe-oF protocol specification cannot offer much difference in terms of architecture or approach, but it does differ in the only way that matters: speed. As it has already been established at the example of Linux and StarWind solutions, the NVMe-oF initiators are capable of providing performance that is barely affected by latency. Strictly speaking, in the case with StarWind NVMe-oF Initiator for Windows, it would have hardly mattered for a lot of people whether the performance level could match local storage or not, since, in the absence of the Windows-native solution from Microsoft, the only alternative available is no NVMe-oF at all.
Purpose
StarWind NVMe-oF Initiator for Windows makes NVMe-oF available for SQL and M&E workloads on Windows and is compatible with all the major NVMe-oF storage vendors. Unfortunately, for enterprise-level IT infrastructures, all of these prospects are secondary in comparison with the performance. When the data transfer speed is critical to the results, every single microsecond can make all the difference, and ensuring the best performance and lowest latency for the users’ mission-critical applications is the number one priority.
That’s why we are going to use the high load Microsoft SQL Server (Always On Availability Groups) so that we could see for ourselves whether StarWind NVMe-oF Initiator for Windows is capable of handling the level of performance of local storage.
Benchmarking Methodology, Details & Results
For this benchmark, we will use two nodes, sw-mssql-01 and sw-mssql-02. These nodes will have two virtual disks respectively (this is where our test database goes):
Storage Spaces Simple from 2x Intel® Optane™ SSD DC P5800X Series (hereinafter referred to as local storage);
SPDK raid0 from 2x Intel® Optane™ SSD DC P5800X Series (hereinafter referred to as remote storage).
Testbed:

Testbed architecture overview:
Microsoft SQL Server nodes:
Hardware:
| sw-mssql-{01..02} | Supermicro (SYS-220U-TNR) |
| CPU | Intel(R) Xeon(R) Platinum 8352Y @2.2GHz |
| Sockets | 2 |
| Cores/Threads | 64/128 |
| RAM | 256Gb |
| Storage | 2x Intel® Optane™ SSD DC P5800X Series (400GB) |
| NICs | 1x ConnectX®-5 EN 100GbE (MCX516A-CDAT) 1x ConnectX®-6 EN 200GbE (MCX613106A-VDAT) |
Software:
| Role | Microsoft SQL Server node |
OS |
Windows Server 2019 Standart Edition (Version 1809) |
MSSQL |
Microsoft SQL Server Enterprise Evaluation (64-bit) (Version 15.0.2000.5) |
StarWind NVMeoF initiator |
Version 1.9.0.471 |
| StarWind Virtual SAN | Version 8.0.14120.0 |
Client node:
Hardware:
| sw-mssql-cli-01 | Supermicro (SYS-2029UZ-TR4+) |
| CPU | Intel(R) Xeon(R) Platinum 8268 CPU @ 2.90GHz |
| Sockets | 2 |
| Cores/Threads | 48/96 |
| RAM | 96Gb |
| NICs | 1x ConnectX®-5 EN 100GbE (MCX516A-CCAT) |
Software:
| Role | Domain controller, Client node |
OS |
Windows Server 2019 Standard Edition (Version 1809) |
HammerDB |
Version 4.2 |
Storage nodes:
Hardware:
| sw-storage-{01..02} | Supermicro (SYS-220U-TNR) |
| CPU | Intel(R) Xeon(R) Platinum 8352Y @2.2GHz |
| Sockets | 2 |
| Cores/Threads | 64/128 |
| RAM | 256Gb |
| Storage | 2x Intel® Optane™ SSD DC P5800X Series (400GB) |
| NICs | 2x ConnectX®-5 EN 100GbE (MCX516A-CDAT) |
Software:
| Role | Storage node, NVMeoF target node |
OS |
CentOS Linux release 8.4.2105 (kernel 5.13.6-1.el8) |
SPDK |
SPDK v21.07 git sha1 adeb0496 |
The benchmark will be held using both DISKSPD and HammerDB utilities. It will be performed in separate stages. At first, we are going to see how different the performances of remote and local storage are using the DISKSPD utility. Furthermore, there comes the comparison of performances of both Microsoft SQL Server Standalone Instance and Microsoft SQL Server Availability Groups at the examples of local storage and remote storage using the HammerDB utility.
Preparation:
1.Add the nodes (sw-mssql-01 and sw-mssql-02) to the cluster using the Microsoft Failover Cluster:

2. Create a fault tolerant virtual disk to act as a quorum using StarWind Virtual SAN:


3. Create Storage Spaces Simple virtual disks on both nodes (sw-mssql-01 and sw-mssql-02):

4. Connect remote disks from the nodes sw-storage-01 and sw-storage-02 to the nodes sw-mssql-01 and sw-mssql-02 respectively using StarWind NVMeoF Initiator;
5. Format disks to NTFS format with the allocation unit size 64K (R: and L: disks).
L: – local disk, Storage Spaces Simple form 2x Intel® Optane™ SSD DC P5800X Series;
R: – remote disk, SPDK raid0 from 2x Intel® Optane™ SSD DC P5800X Series.
Benchmarking Results:
DISKSPD:
This benchmark serves to define the performance of the local storage (Storage Spaces Simple) and the remote one (SPDK RAID0), connected through the NVMe-oF Initiator. With the consideration of the fact that Microsoft SQL Server operates at the file level, the disks in NTFS have the allocation unit size 64K. Needless to say, the benchmark patterns and block sizes below are most common for Microsoft SQL Server storage operations.
Master Database Files (MDF) workloads:
| Test file size 400GB | Local disk (L:) | Remote disk (R:) | Comparison | ||||||||||
| Test pattern | Block size | Threads | I/O depth | I/Ops | MBps | Latency (ms) | I/Ops | MBps | Latency (ms) | I/Ops | MBps | Latency | |
| Random | Read | 8k | 4 | 4 | 452210 | 3533 | 0,026 | 346726 | 2709 | 0,046 | 77% | 77% | 177% |
| 8k | 4 | 8 | 453187 | 3541 | 0,062 | 431432 | 3371 | 0,074 | 95% | 95% | 119% | ||
| 8k | 4 | 16 | 447659 | 3497 | 0,134 | 465596 | 3637 | 0,137 | 104% | 104% | 102% | ||
| 8k | 8 | 4 | 774466 | 6051 | 0,032 | 634054 | 4954 | 0,050 | 82% | 82% | 156% | ||
| 8k | 8 | 8 | 775776 | 6061 | 0,072 | 749618 | 5856 | 0,085 | 97% | 97% | 118% | ||
| 8k | 8 | 16 | 770262 | 6018 | 0,156 | 797587 | 6231 | 0,160 | 104% | 104% | 103% | ||
| 8k | 16 | 4 | 1023902 | 7999 | 0,047 | 986691 | 7709 | 0,065 | 96% | 96% | 138% | ||
| 8k | 16 | 8 | 1021816 | 7983 | 0,109 | 1052851 | 8225 | 0,121 | 103% | 103% | 111% | ||
| 8k | 16 | 16 | 1020694 | 7974 | 0,235 | 1080298 | 8440 | 0,237 | 106% | 106% | 101% | ||
| 8k | 32 | 4 | 923119 | 7212 | 0,104 | 968126 | 7563 | 0,130 | 105% | 105% | 125% | ||
| 8k | 32 | 8 | 933105 | 7290 | 0,240 | 971248 | 7588 | 0,259 | 104% | 104% | 108% | ||
| 8k | 32 | 16 | 930719 | 7271 | 0,515 | 985062 | 7696 | 0,516 | 106% | 106% | 100% | ||
| Write | 8k | 4 | 4 | 426253 | 3330 | 0,034 | 326654 | 2552 | 0,049 | 77% | 77% | 144% | |
| 8k | 4 | 8 | 425424 | 3324 | 0,066 | 404428 | 3160 | 0,078 | 95% | 95% | 118% | ||
| 8k | 4 | 16 | 427347 | 3339 | 0,140 | 437662 | 3419 | 0,146 | 102% | 102% | 104% | ||
| 8k | 8 | 4 | 742174 | 5798 | 0,041 | 589258 | 4604 | 0,054 | 79% | 79% | 132% | ||
| 8k | 8 | 8 | 741386 | 5792 | 0,075 | 692854 | 5413 | 0,091 | 93% | 93% | 121% | ||
| 8k | 8 | 16 | 743606 | 5809 | 0,161 | 728766 | 5693 | 0,171 | 98% | 98% | 106% | ||
| 8k | 16 | 4 | 1030897 | 8054 | 0,062 | 882748 | 6896 | 0,072 | 86% | 86% | 116% | ||
| 8k | 16 | 8 | 1029863 | 8046 | 0,109 | 1033064 | 8071 | 0,124 | 100% | 100% | 114% | ||
| 8k | 16 | 16 | 1028386 | 8034 | 0,233 | 1063625 | 8310 | 0,240 | 103% | 103% | 103% | ||
| 8k | 32 | 4 | 874428 | 6831 | 0,110 | 959987 | 7500 | 0,133 | 110% | 110% | 121% | ||
| 8k | 32 | 8 | 874637 | 6833 | 0,256 | 974352 | 7612 | 0,260 | 111% | 111% | 102% | ||
| 8k | 32 | 16 | 877076 | 6852 | 0,547 | 983368 | 7683 | 0,518 | 112% | 112% | 95% | ||
| Test file size 400GB | Local disk (L:) | Remote disk (R:) | Comparison | ||||||||||
| Test pattern | Block size | Threads | I/O depth | I/Ops | MBps | Latency (ms) | I/Ops | MBps | Latency (ms) | I/Ops | MBps | Latency | |
| Random | Read/Write 60/40 |
8k | 4 | 4 | 438321 | 3424 | 0,027 | 337876 | 2640 | 0,047 | 77% | 77% | 174% |
| 8k | 4 | 8 | 436505 | 3410 | 0,064 | 417883 | 3265 | 0,076 | 96% | 96% | 119% | ||
| 8k | 4 | 16 | 436222 | 3408 | 0,137 | 452008 | 3531 | 0,141 | 104% | 104% | 103% | ||
| 8k | 8 | 4 | 756500 | 5910 | 0,035 | 615369 | 4808 | 0,052 | 81% | 81% | 149% | ||
| 8k | 8 | 8 | 755582 | 5903 | 0,074 | 726659 | 5677 | 0,087 | 96% | 96% | 118% | ||
| 8k | 8 | 16 | 757605 | 5919 | 0,158 | 767868 | 5999 | 0,164 | 101% | 101% | 104% | ||
| 8k | 16 | 4 | 1026260 | 8018 | 0,059 | 966484 | 7551 | 0,066 | 94% | 94% | 112% | ||
| 8k | 16 | 8 | 1024645 | 8005 | 0,117 | 1052538 | 8223 | 0,121 | 103% | 103% | 103% | ||
| 8k | 16 | 16 | 1024153 | 8001 | 0,234 | 1081764 | 8451 | 0,236 | 106% | 106% | 101% | ||
| 8k | 32 | 4 | 898509 | 7020 | 0,118 | 957946 | 7484 | 0,132 | 107% | 107% | 112% | ||
| 8k | 32 | 8 | 897383 | 7011 | 0,249 | 967748 | 7561 | 0,262 | 108% | 108% | 105% | ||
| 8k | 32 | 16 | 901274 | 7041 | 0,532 | 983779 | 7686 | 0,518 | 109% | 109% | 97% | ||
| Read/Write 40/60 |
8k | 4 | 4 | 428689 | 3349 | 0,029 | 334287 | 2612 | 0,048 | 78% | 78% | 166% | |
| 8k | 4 | 8 | 430305 | 3362 | 0,065 | 411856 | 3218 | 0,078 | 96% | 96% | 120% | ||
| 8k | 4 | 16 | 429201 | 3353 | 0,140 | 443415 | 3464 | 0,144 | 103% | 103% | 103% | ||
| 8k | 8 | 4 | 749105 | 5852 | 0,041 | 607243 | 4744 | 0,053 | 81% | 81% | 129% | ||
| 8k | 8 | 8 | 749480 | 5855 | 0,074 | 711163 | 5556 | 0,090 | 95% | 95% | 122% | ||
| 8k | 8 | 16 | 753685 | 5888 | 0,159 | 744860 | 5819 | 0,170 | 99% | 99% | 107% | ||
| 8k | 16 | 4 | 1025172 | 8009 | 0,062 | 941043 | 7352 | 0,068 | 92% | 92% | 110% | ||
| 8k | 16 | 8 | 1024748 | 8006 | 0,109 | 1030678 | 8052 | 0,124 | 101% | 101% | 114% | ||
| 8k | 16 | 16 | 1024585 | 8005 | 0,234 | 1054612 | 8239 | 0,242 | 103% | 103% | 103% | ||
| 8k | 32 | 4 | 894711 | 6990 | 0,107 | 957053 | 7477 | 0,133 | 107% | 107% | 124% | ||
| 8k | 32 | 8 | 893407 | 6980 | 0,255 | 968267 | 7565 | 0,262 | 108% | 108% | 103% | ||
| 8k | 32 | 16 | 894168 | 6986 | 0,550 | 982139 | 7673 | 0,517 | 110% | 110% | 94% | ||
| Test file size 400GB | Local disk (L:) | Remote disk (R:) | Comparison | ||||||||||
| Test pattern | Block size | Threads | I/O depth | I/Ops | MBps | Latency (ms) | I/Ops | MBps | Latency (ms) | I/Ops | MBps | Latency | |
| Random | Read | 64k | 2 | 2 | 114379 | 7149 | 0,035 | 77272 | 4829 | 0,051 | 68% | 68% | 146% |
| 64k | 2 | 4 | 169787 | 10612 | 0,047 | 104163 | 6510 | 0,076 | 61% | 61% | 162% | ||
| 64k | 2 | 8 | 207476 | 12967 | 0,077 | 114407 | 7150 | 0,127 | 55% | 55% | 165% | ||
| 64k | 4 | 2 | 175748 | 10984 | 0,045 | 123222 | 7701 | 0,065 | 70% | 70% | 144% | ||
| 64k | 4 | 4 | 211912 | 13245 | 0,075 | 179875 | 11242 | 0,088 | 85% | 85% | 117% | ||
| 64k | 4 | 8 | 220444 | 13778 | 0,145 | 200082 | 12505 | 0,154 | 91% | 91% | 106% | ||
| 64k | 8 | 2 | 212480 | 13280 | 0,075 | 190394 | 11900 | 0,084 | 90% | 90% | 112% | ||
| 64k | 8 | 4 | 220489 | 13781 | 0,145 | 218856 | 13679 | 0,146 | 99% | 99% | 101% | ||
| 64k | 8 | 8 | 223010 | 13938 | 0,287 | 222861 | 13929 | 0,287 | 100% | 100% | 100% | ||
| 64k | 16 | 2 | 220504 | 13782 | 0,145 | 218002 | 13625 | 0,146 | 99% | 99% | 101% | ||
| 64k | 16 | 4 | 223087 | 13943 | 0,287 | 222842 | 13928 | 0,287 | 100% | 100% | 100% | ||
| 64k | 16 | 8 | 224165 | 14010 | 0,571 | 224318 | 14020 | 0,570 | 100% | 100% | 100% | ||
| Write | 64k | 2 | 2 | 99589 | 6224 | 0,040 | 68432 | 4277 | 0,058 | 69% | 69% | 145% | |
| 64k | 2 | 4 | 130258 | 8141 | 0,061 | 98202 | 6138 | 0,081 | 75% | 75% | 133% | ||
| 64k | 2 | 8 | 144870 | 9054 | 0,110 | 109409 | 6838 | 0,145 | 76% | 76% | 132% | ||
| 64k | 4 | 2 | 131697 | 8231 | 0,061 | 102934 | 6433 | 0,077 | 78% | 78% | 126% | ||
| 64k | 4 | 4 | 145058 | 9066 | 0,110 | 138960 | 8685 | 0,115 | 96% | 96% | 105% | ||
| 64k | 4 | 8 | 149092 | 9318 | 0,214 | 146892 | 9181 | 0,217 | 99% | 99% | 101% | ||
| 64k | 8 | 2 | 145152 | 9072 | 0,110 | 137721 | 8608 | 0,116 | 95% | 95% | 105% | ||
| 64k | 8 | 4 | 149135 | 9321 | 0,214 | 146985 | 9187 | 0,217 | 99% | 99% | 101% | ||
| 64k | 8 | 8 | 150643 | 9415 | 0,425 | 148954 | 9310 | 0,429 | 99% | 99% | 101% | ||
| 64k | 16 | 2 | 149052 | 9316 | 0,214 | 146489 | 9156 | 0,218 | 98% | 98% | 102% | ||
| 64k | 16 | 4 | 150704 | 9419 | 0,424 | 149021 | 9314 | 0,429 | 99% | 99% | 101% | ||
| 64k | 16 | 8 | 151326 | 9458 | 0,846 | 149985 | 9374 | 0,853 | 99% | 99% | 101% | ||
| Test file size 400GB | Local disk (L:) | Remote disk (R:) | Comparison | ||||||||||
| Test pattern | Block size | Threads | I/O depth | I/Ops | MBps | Latency (ms) | I/Ops | MBps | Latency (ms) | I/Ops | MBps | Latency | |
| Random | Read/Write 60/40 |
64k | 2 | 2 | 105280 | 6580 | 0,038 | 66838 | 4177 | 0,059 | 63% | 63% | 155% |
| 64k | 2 | 4 | 146524 | 9158 | 0,054 | 99106 | 6194 | 0,080 | 68% | 68% | 148% | ||
| 64k | 2 | 8 | 167497 | 10469 | 0,095 | 106669 | 6667 | 0,135 | 64% | 64% | 142% | ||
| 64k | 4 | 2 | 149380 | 9336 | 0,053 | 102116 | 6382 | 0,078 | 68% | 68% | 147% | ||
| 64k | 4 | 4 | 168289 | 10518 | 0,095 | 151131 | 9446 | 0,105 | 90% | 90% | 111% | ||
| 64k | 4 | 8 | 173522 | 10845 | 0,184 | 166523 | 10408 | 0,191 | 96% | 96% | 104% | ||
| 64k | 8 | 2 | 168425 | 10527 | 0,095 | 154355 | 9647 | 0,103 | 92% | 92% | 108% | ||
| 64k | 8 | 4 | 173468 | 10842 | 0,184 | 171797 | 10737 | 0,186 | 99% | 99% | 101% | ||
| 64k | 8 | 8 | 175417 | 10964 | 0,365 | 174604 | 10913 | 0,366 | 100% | 100% | 100% | ||
| 64k | 16 | 2 | 173547 | 10847 | 0,184 | 171233 | 10702 | 0,186 | 99% | 99% | 101% | ||
| 64k | 16 | 4 | 175469 | 10967 | 0,364 | 174646 | 10915 | 0,366 | 100% | 100% | 101% | ||
| 64k | 16 | 8 | 176204 | 11013 | 0,726 | 175733 | 10983 | 0,728 | 100% | 100% | 100% | ||
| Read/Write 40/60 |
64k | 2 | 2 | 102746 | 6422 | 0,039 | 65836 | 4115 | 0,060 | 64% | 64% | 154% | |
| 64k | 2 | 4 | 139590 | 8724 | 0,057 | 98132 | 6133 | 0,081 | 70% | 70% | 142% | ||
| 64k | 2 | 8 | 156579 | 9786 | 0,102 | 108948 | 6809 | 0,137 | 70% | 70% | 134% | ||
| 64k | 4 | 2 | 141753 | 8860 | 0,056 | 99204 | 6200 | 0,080 | 70% | 70% | 143% | ||
| 64k | 4 | 4 | 157032 | 9814 | 0,102 | 144583 | 9036 | 0,110 | 92% | 92% | 108% | ||
| 64k | 4 | 8 | 161420 | 10089 | 0,198 | 159504 | 9969 | 0,200 | 99% | 99% | 101% | ||
| 64k | 8 | 2 | 157168 | 9823 | 0,102 | 146102 | 9131 | 0,109 | 93% | 93% | 107% | ||
| 64k | 8 | 4 | 161491 | 10093 | 0,198 | 160198 | 10012 | 0,199 | 99% | 99% | 101% | ||
| 64k | 8 | 8 | 163141 | 10196 | 0,392 | 162680 | 10167 | 0,393 | 100% | 100% | 100% | ||
| 64k | 16 | 2 | 161430 | 10089 | 0,198 | 159668 | 9979 | 0,200 | 99% | 99% | 101% | ||
| 64k | 16 | 4 | 163124 | 10195 | 0,392 | 162597 | 10162 | 0,393 | 100% | 100% | 100% | ||
| 64k | 16 | 8 | 163949 | 10247 | 0,780 | 163610 | 10226 | 0,782 | 100% | 100% | 100% | ||
| Test file size 400GB | Local disk (L:) | Remote disk (R:) | Comparison | ||||||||||
| Test pattern | Block size | Threads | I/O depth | I/Ops | MBps | Latency (ms) | I/Ops | MBps | Latency (ms) | I/Ops | MBps | Latency | |
| Random | Read | 512k | 1 | 1 | 12709 | 6355 | 0,078 | 11243 | 5622 | 0,088 | 88% | 88% | 113% |
| 512k | 1 | 2 | 21231 | 10616 | 0,094 | 13760 | 6880 | 0,145 | 65% | 65% | 154% | ||
| 512k | 2 | 1 | 25089 | 12544 | 0,079 | 12441 | 6221 | 0,160 | 50% | 50% | 203% | ||
| 512k | 2 | 2 | 28130 | 14065 | 0,142 | 19346 | 9673 | 0,206 | 69% | 69% | 145% | ||
| 512k | 4 | 1 | 28130 | 14065 | 0,141 | 21930 | 10965 | 0,182 | 78% | 78% | 129% | ||
| 512k | 4 | 2 | 28136 | 14068 | 0,284 | 28064 | 14032 | 0,285 | 100% | 100% | 100% | ||
| Write | 512k | 1 | 1 | 12125 | 6062 | 0,082 | 9797 | 4899 | 0,102 | 81% | 81% | 124% | |
| 512k | 1 | 2 | 17713 | 8856 | 0,113 | 14235 | 7117 | 0,140 | 80% | 80% | 124% | ||
| 512k | 2 | 1 | 18375 | 9187 | 0,108 | 10813 | 5407 | 0,184 | 59% | 59% | 170% | ||
| 512k | 2 | 2 | 18928 | 9464 | 0,211 | 18579 | 9289 | 0,215 | 98% | 98% | 102% | ||
| 512k | 4 | 1 | 18919 | 9459 | 0,211 | 17495 | 8747 | 0,228 | 92% | 92% | 108% | ||
| 512k | 4 | 2 | 18964 | 9482 | 0,421 | 18707 | 9354 | 0,427 | 99% | 99% | 101% | ||
| Test file size 400GB | Local disk (L:) | Remote disk (R:) | Comparison | ||||||||||
| Test pattern | Block size | Threads | I/O depth | I/Ops | MBps | Latency (ms) | I/Ops | MBps | Latency (ms) | I/Ops | MBps | Latency | |
| Random | Read/Write 60/40 |
512k | 1 | 1 | 12473 | 6236 | 0,080 | 10577 | 5289 | 0,094 | 85% | 85% | 118% |
| 512k | 1 | 2 | 19104 | 9552 | 0,104 | 13909 | 6955 | 0,143 | 73% | 73% | 138% | ||
| 512k | 2 | 1 | 20808 | 10404 | 0,096 | 11827 | 5913 | 0,168 | 57% | 57% | 175% | ||
| 512k | 2 | 2 | 22753 | 11376 | 0,175 | 19614 | 9807 | 0,203 | 86% | 86% | 116% | ||
| 512k | 4 | 1 | 22748 | 11374 | 0,175 | 19415 | 9708 | 0,205 | 85% | 85% | 117% | ||
| 512k | 4 | 2 | 22798 | 11399 | 0,350 | 22502 | 11251 | 0,355 | 99% | 99% | 101% | ||
| Read/Write 40/60 |
512k | 1 | 1 | 12330 | 6165 | 0,081 | 10216 | 5108 | 0,097 | 83% | 83% | 120% | |
| 512k | 1 | 2 | 18519 | 9259 | 0,108 | 14007 | 7003 | 0,142 | 76% | 76% | 131% | ||
| 512k | 2 | 1 | 19756 | 9878 | 0,101 | 11461 | 5730 | 0,174 | 58% | 58% | 172% | ||
| 512k | 2 | 2 | 21126 | 10563 | 0,189 | 19587 | 9794 | 0,204 | 93% | 93% | 108% | ||
| 512k | 4 | 1 | 21122 | 10561 | 0,189 | 18755 | 9377 | 0,213 | 89% | 89% | 113% | ||
| 512k | 4 | 2 | 21177 | 10589 | 0,377 | 20934 | 10467 | 0,382 | 99% | 99% | 101% | ||
As you can see clearly for yourself, there is an obvious difference in performance (~30%-40%) in the cases with the small blocks and short I/O queues. Whenever these parameters are growing, the performance is growing respectively and can match that of the local disk.
Log Database Files (LDF) workloads:
| Test file size 400GB | Local disk (L:) | Remote disk (R:) | Comparison | ||||||||||
| Test pattern | Block size | Threads | I/O depth | I/Ops | MBps | Latency (ms) | I/Ops | MBps | Latency (ms) | I/Ops | MBps | Latency | |
| Sequential | Read/Write 60/40 |
60k | 1 | 4 | 81106 | 4752 | 0,049 | 76590 | 4488 | 0,052 | 94% | 94% | 106% |
| 60k | 1 | 8 | 81496 | 4775 | 0,086 | 77620 | 4548 | 0,090 | 95% | 95% | 105% | ||
| 60k | 1 | 16 | 81416 | 4771 | 0,184 | 77437 | 4537 | 0,193 | 95% | 95% | 105% | ||
| 60k | 2 | 4 | 134992 | 7910 | 0,059 | 102707 | 6018 | 0,078 | 76% | 76% | 132% | ||
| 60k | 2 | 8 | 136012 | 7969 | 0,103 | 110104 | 6451 | 0,131 | 81% | 81% | 127% | ||
| 60k | 2 | 16 | 136218 | 7982 | 0,220 | 111734 | 6547 | 0,268 | 82% | 82% | 122% | ||
| 60k | 4 | 4 | 184695 | 10822 | 0,086 | 169596 | 9937 | 0,094 | 92% | 92% | 109% | ||
| 60k | 4 | 8 | 185479 | 10868 | 0,172 | 178144 | 10438 | 0,179 | 96% | 96% | 104% | ||
| 60k | 4 | 16 | 185681 | 10880 | 0,344 | 168821 | 9892 | 0,367 | 91% | 91% | 107% | ||
| 60k | 8 | 4 | 185540 | 10872 | 0,172 | 184214 | 10794 | 0,173 | 99% | 99% | 101% | ||
| 60k | 8 | 8 | 185741 | 10883 | 0,344 | 184516 | 10811 | 0,347 | 99% | 99% | 101% | ||
| 60k | 8 | 16 | 185800 | 10887 | 0,689 | 184645 | 10819 | 0,693 | 99% | 99% | 101% | ||
| Read/Write 40/60 |
60k | 1 | 4 | 81341 | 4766 | 0,049 | 76219 | 4466 | 0,052 | 94% | 94% | 106% | |
| 60k | 1 | 8 | 81197 | 4758 | 0,086 | 76710 | 4495 | 0,091 | 94% | 94% | 106% | ||
| 60k | 1 | 16 | 81012 | 4747 | 0,185 | 76767 | 4498 | 0,195 | 95% | 95% | 105% | ||
| 60k | 2 | 4 | 135505 | 7940 | 0,059 | 99364 | 5822 | 0,080 | 73% | 73% | 136% | ||
| 60k | 2 | 8 | 135981 | 7968 | 0,103 | 111631 | 6541 | 0,134 | 82% | 82% | 130% | ||
| 60k | 2 | 16 | 135945 | 7966 | 0,220 | 111341 | 6524 | 0,269 | 82% | 82% | 122% | ||
| 60k | 4 | 4 | 172336 | 10098 | 0,093 | 163242 | 9565 | 0,098 | 95% | 95% | 105% | ||
| 60k | 4 | 8 | 173004 | 10137 | 0,185 | 168799 | 9891 | 0,189 | 98% | 98% | 102% | ||
| 60k | 4 | 16 | 173185 | 10148 | 0,369 | 168330 | 9863 | 0,380 | 97% | 97% | 103% | ||
| 60k | 8 | 4 | 173090 | 10142 | 0,185 | 171893 | 10072 | 0,186 | 99% | 99% | 101% | ||
| 60k | 8 | 8 | 173293 | 10154 | 0,369 | 172174 | 10088 | 0,371 | 99% | 99% | 101% | ||
| 60k | 8 | 16 | 173384 | 10159 | 0,738 | 172229 | 10092 | 0,743 | 99% | 99% | 101% | ||
| Test file size 400GB | Local disk (L:) | Remote disk (R:) | Comparison | ||||||||||
| Test pattern | Block size | Threads | I/O depth | I/Ops | MBps | Latency (ms) | I/Ops | MBps | Latency (ms) | I/Ops | MBps | Latency | |
| Sequential | Read/Write 60/40 |
120K | 1 | 4 | 58483 | 6853 | 0,068 | 47247 | 5537 | 0,084 | 81% | 81% | 124% |
| 120K | 1 | 8 | 58715 | 6881 | 0,119 | 47223 | 5534 | 0,148 | 80% | 80% | 124% | ||
| 120K | 1 | 16 | 58421 | 6846 | 0,257 | 47235 | 5535 | 0,317 | 81% | 81% | 123% | ||
| 120K | 2 | 4 | 92995 | 10898 | 0,086 | 57116 | 6693 | 0,136 | 61% | 61% | 158% | ||
| 120K | 2 | 8 | 93690 | 10979 | 0,171 | 68485 | 8026 | 0,219 | 73% | 73% | 128% | ||
| 120K | 2 | 16 | 93825 | 10995 | 0,341 | 68661 | 8046 | 0,437 | 73% | 73% | 128% | ||
| 120K | 4 | 4 | 93767 | 10988 | 0,170 | 91312 | 10701 | 0,175 | 97% | 97% | 103% | ||
| 120K | 4 | 8 | 93856 | 10999 | 0,341 | 93015 | 10900 | 0,344 | 99% | 99% | 101% | ||
| 120K | 4 | 16 | 93875 | 11001 | 0,682 | 93047 | 10904 | 0,688 | 99% | 99% | 101% | ||
| 120K | 8 | 4 | 93887 | 11002 | 0,341 | 93019 | 10901 | 0,344 | 99% | 99% | 101% | ||
| 120K | 8 | 8 | 93905 | 11004 | 0,681 | 93061 | 10906 | 0,687 | 99% | 99% | 101% | ||
| 120K | 8 | 16 | 93872 | 11001 | 1,363 | 92723 | 10866 | 1,380 | 99% | 99% | 101% | ||
| Read/Write 40/60 |
120K | 1 | 4 | 58810 | 6892 | 0,068 | 47131 | 5523 | 0,084 | 80% | 80% | 124% | |
| 120K | 1 | 8 | 58754 | 6885 | 0,119 | 47189 | 5530 | 0,148 | 80% | 80% | 124% | ||
| 120K | 1 | 16 | 58650 | 6873 | 0,256 | 47070 | 5516 | 0,318 | 80% | 80% | 124% | ||
| 120K | 2 | 4 | 87330 | 10234 | 0,091 | 64138 | 7516 | 0,120 | 73% | 73% | 132% | ||
| 120K | 2 | 8 | 87345 | 10236 | 0,183 | 68456 | 8022 | 0,219 | 78% | 78% | 120% | ||
| 120K | 2 | 16 | 87442 | 10247 | 0,366 | 68572 | 8036 | 0,437 | 78% | 78% | 119% | ||
| 120K | 4 | 4 | 87404 | 10243 | 0,183 | 85696 | 10042 | 0,186 | 98% | 98% | 102% | ||
| 120K | 4 | 8 | 87473 | 10251 | 0,366 | 86725 | 10163 | 0,369 | 99% | 99% | 101% | ||
| 120K | 4 | 16 | 87516 | 10256 | 0,731 | 86778 | 10169 | 0,737 | 99% | 99% | 101% | ||
| 120K | 8 | 4 | 87516 | 10256 | 0,365 | 86690 | 10159 | 0,369 | 99% | 99% | 101% | ||
| 120K | 8 | 8 | 87548 | 10260 | 0,731 | 86764 | 10168 | 0,737 | 99% | 99% | 101% | ||
| 120K | 8 | 16 | 87529 | 10257 | 1,462 | 86260 | 10109 | 1,484 | 99% | 99% | 102% | ||
Microsoft SQL Server local & remote storage performance (HammerDB):
This benchmark is meant to compare the performance of the Microsoft SQL Server for the OLTP workload in a scenario wherein the database is allocated both on the local and remote storages. The benchmark will be held to measure the performance of both Standalone Instance and Availability Groups.
Basically, an OLTP (online transaction processing) workload is usually identified by a database receiving both requests for data and multiple changes to this data from a number of users over time where these modifications are called transactions.
Every single transaction has a defined beginning point. It modifies the data within the database and either commits the changes or takes them back to the starting point (more info here). Although designing and implementing a database benchmark is quite a task to take upon, TPROC-C is the OLTP workload implemented in HammerDB derived from the TPC-C specification with modification to make running HammerDB straightforward and cost-effective on any of the supported database environments (details up here).
Now, let’s get back to work, shall we?
Building the Schema:
- Benchmark Options: TPROC-C;
- RDBMS: Microsoft SQL Server;
- Database Name: BenchmarkDB;
- Number of Warehouses: 5000;
- Number of Virtual Users: 100.

The amount of warehouses directly affects the database size, which is why it was picked specifically to match the size of available storage resulting in the database with 670GB size. To make sure the results remain untainted, we did a backup of the database and were recovering it before every single test.
Availability Group parameters:
- Name: SW-MSSQL-AG;
- Replicas: SW-MSSQL-01 and SW-MSSQL-02;
- Availability Mode: Synchronous Commit;
- Failover Mode: Automatic;
- Listener Name: SW-MSSQL-AG;
- Data Synchronization: Automatic seeding


HammerDB benchmark parameters:
- RDBMS: Microsoft SQL Server;
- Database Name: BenchmarkDB;
- Use All Warehouses: TRUE;
- Timed Driver Script: TRUE;
- Ramp Up Time (Minutes): 3;
- Test Duration (Minues): 5;
- Number of Virtual Users: {100,150,200,400,600,800}.
In order to show how the performance and load are going through changes depending on RAM, here is additional benchmarking with Microsoft SQL Server being given 256GB, 128GB, and 64GB RAM respectively:
Microsoft SQL Server – 256GB RAM:
| Standalone Instance | Availability Groups | |||||||
| Local Storage (L:) | Remote Storage (R:) | Local Storage (L:) | Remote Storage (R:) | |||||
| Virtual Users | NOPM | NOPM | % | Virtual Users | NOPM | NOPM | % | |
| 100 | 1 929 194 | 1 567 104 | 81% | 100 | 1 521 866 | 1 095 800 | 72% | |
| 150 | 1 897 995 | 1 683 390 | 89% | 150 | 1 646 905 | 1 127 067 | 68% | |
| 200 | 2 092 169 | 1 888 431 | 90% | 200 | 1 796 542 | 1 326 668 | 74% | |
| 400 | 2 156 676 | 2 090 032 | 97% | 400 | 1 979 146 | 1 857 830 | 94% | |
| 600 | 2 134 175 | 2 222 587 | 104% | 600 | 2 086 215 | 1 863 549 | 89% | |
| 800 | 2 371 548 | 2 244 145 | 95% | 800 | 2 053 846 | 1 955 081 | 95% | |
| Virtual Users | TPM | TPM | % | Virtual Users | TPM | TPM | % | |
| 100 | 4 438 847 | 3 604 163 | 81% | 100 | 3 502 152 | 2 522 072 | 72% | |
| 150 | 4 365 824 | 3 873 318 | 89% | 150 | 3 786 312 | 2 557 345 | 68% | |
| 200 | 4 810 597 | 4 344 514 | 90% | 200 | 4 132 772 | 3 051 800 | 74% | |
| 400 | 4 959 970 | 4 807 505 | 97% | 400 | 4 551 920 | 4 272 246 | 94% | |
| 600 | 4 925 801 | 5 128 099 | 104% | 600 | 4 816 668 | 4 292 334 | 89% | |
| 800 | 5 483 501 | 5 191 699 | 95% | 800 | 4 745 047 | 4 517 652 | 95% | |
NOPM – new order per minute;
TPM – Transaction per minute.
Storage throughput usage:


Microsoft SQL Server – 128GB RAM:
| Standalone Instance | Availability Groups | |||||||
| Local Storage (L:) | Remote Storage (R:) | Local Storage (L:) | Remote Storage (R:) | |||||
| Virtual Users | NOPM | NOPM | % | Virtual Users | NOPM | NOPM | % | |
| 100 | 1 926 874 | 1 491 056 | 77% | 100 | 1 539 503 | 1 015 689 | 66% | |
| 150 | 1 975 635 | 1 713 846 | 87% | 150 | 1 651 494 | 1 040 035 | 63% | |
| 200 | 2 038 390 | 1 923 053 | 94% | 200 | 1 770 625 | 1 213 270 | 69% | |
| 400 | 2 187 896 | 2 121 844 | 97% | 400 | 1 882 403 | 1 713 550 | 91% | |
| 600 | 2 216 416 | 2 138 098 | 96% | 600 | 1 980 678 | 1 810 855 | 91% | |
| 800 | 2 227 702 | 2 166 103 | 97% | 800 | 2 087 819 | 1 898 871 | 91% | |
| Virtual Users | TPM | TPM | % | Virtual Users | TPM | TPM | % | |
| 100 | 4 432 816 | 3 429 186 | 77% | 100 | 3 539 969 | 2 337 354 | 66% | |
| 150 | 4 544 250 | 3 943 020 | 87% | 150 | 3 799 009 | 2 392 843 | 63% | |
| 200 | 4 688 079 | 4 426 693 | 94% | 200 | 4 072 705 | 2 789 238 | 68% | |
| 400 | 5 032 145 | 4 879 487 | 97% | 400 | 4 330 568 | 3 940 653 | 91% | |
| 600 | 5 115 181 | 4 922 189 | 96% | 600 | 4 567 002 | 4 168 913 | 91% | |
| 800 | 5 156 986 | 5 017 358 | 97% | 800 | 4 827 349 | 4 371 248 | 91% | |
NOPM – new order per minute;
TPM – Transaction per minute.
Storage throughput usage:


Microsoft SQL Server – 64GB RAM:
| Standalone Instance | Availability Groups | |||||||
| Local Storage (L:) | Remote Storage (R:) | Local Storage (L:) | Remote Storage (R:) | |||||
| Virtual Users | NOPM | NOPM | % | Virtual Users | NOPM | NOPM | % | |
| 100 | 1 847 859 | 1 432 296 | 78% | 100 | 1 475 082 | 976 524 | 66% | |
| 150 | 1 957 018 | 1 690 486 | 86% | 150 | 1 588 708 | 1 049 699 | 66% | |
| 200 | 2 056 806 | 1 938 364 | 94% | 200 | 1 563 825 | 1 199 712 | 77% | |
| 400 | 2 145 978 | 2 051 504 | 96% | 400 | 1 810 109 | 1 566 695 | 87% | |
| 600 | 2 249 779 | 2 093 142 | 93% | 600 | 1 785 595 | 1 717 231 | 96% | |
| 800 | 2 274 036 | 2 116 673 | 93% | 800 | 1 924 572 | 1 880 321 | 98% | |
| Virtual Users | TPM | TPM | % | Virtual Users | TPM | TPM | % | |
| 100 | 4 249 193 | 3 295 441 | 78% | 100 | 3 392 623 | 2 245 828 | 66% | |
| 150 | 4 500 177 | 3 886 407 | 86% | 150 | 3 653 900 | 2 415 594 | 66% | |
| 200 | 4 770 051 | 4 458 108 | 93% | 200 | 3 597 298 | 2 759 022 | 77% | |
| 400 | 4 937 081 | 4 719 667 | 96% | 400 | 4 174 774 | 3 608 951 | 86% | |
| 600 | 5 181 575 | 4 819 719 | 93% | 600 | 4 115 204 | 3 951 591 | 96% | |
| 800 | 5 253 317 | 4 884 747 | 93% | 800 | 4 441 703 | 4 337 072 | 98% | |
NOPM – new order per minute;
TPM – Transaction per minute.
Storage throughput usage:


The benchmarking results shown are clear and definite: as you can observe, with a large number of Virtual Users (100,150,200), the performance difference between the local and remote storages could go up to ~30%. However, if we are to enlarge that number to 400,600,800, the performance difference becomes almost insignificant and does not exceed ~5%-10%.
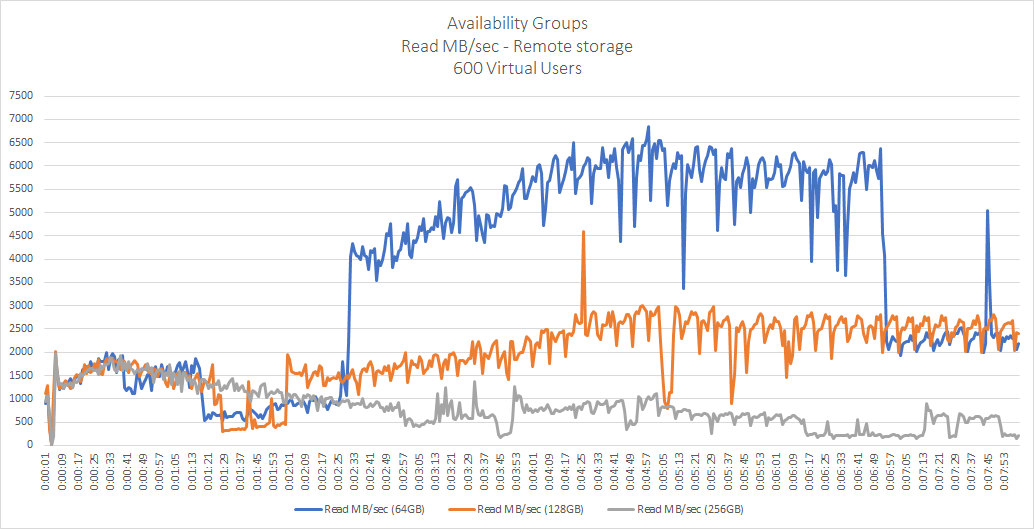
Read throughput comparison (Microsoft SQL Server 64GB, 128GB, 256GB of RAM):
Moreover, the shortage of RAM for SQL server practically does not have any impact on write operations, but it does have a huge impact on read operations.
Conclusion
To sum up, the results of testing both with the means of DISKSPD and HammerDB have shown a clear and coherent picture. In particular, in the case with the latter, it becomes evident StarWind NVMe-oF Initiator for Windows handles large amounts of Virtual Users (400,600,800) quite well considering that the difference in performance doesn’t exceed 5-10%. However, when it comes to the loads with short queues, the picture is entirely different. With less than a numerous amount of Virtual Users (100,150,200), the performance difference reaches about 30%! The DISKSPD shows nearly the same numbers, with performance difference while handling small loads going up to 30-40%. Nevertheless, there’s nothing mysterious in such disproportional results since it has fairly nothing to do with the solution itself.
Due to the specifics of Windows storage stack architecture, the StarWind NVMe-oF driver is written as a Storport miniport because it is the only way Microsoft would support a block storage driver. Are there other options, you may ask? Of course, there are. However, as you can rightly guess, there are upside downs to that as well. For example, a monolithic SCSI port could have been a great alternative, although it lacks proper documentation. A class driver is quite efficient and useful, but it brings another headache as the system will neither handle SCSI reservation properly nor allow putting CSV (Cluster Shared Volume) on top of it. Essentially, StarWind NVMe-oF Initiator for Windows provides a fully compatible and Windows-certified NVMe-oF specification. Its performance as of now matches the performance of local storage and is only limited from the system side.
This material has been prepared in collaboration with Viktor Kushnir, Technical Writer with almost 3 years of experience at StarWind.