Introduction
Considering how often I see NVMe-related titles over the Internet, I consider NVMe-oF to be a hot topic. That’s why I decided to play a bit with this tech 🙂
NVMe is quite a promising technology that becomes more and more prevalent in IT environments of any size. PCIe SSDs deliver awesome performance, low latencies… still, they are far too expensive. Anyway, money, in this case, seems a problem of secondary importance. The main reason why many have not added NVMe drives to their servers yet is inability of this storage media to be presented effectively over the network: iSCSI seems to be inefficient for flash, so it is an issue. Solution? NVMe over Fabrics (NVMe-oF or NVMf, how it was called before) – the protocol created to present NVMe flash over the network! Sounds great, but there’s a problem with NVMe-oF itself: most of hypervisors just do not support this protocol natively! The solution seems rather simple: just bring its support on the client and server sides with 3rd party!
In this article series, I’d like to take a closer look at the existing implementations of NVMe-oF. In particular, I’m going to take a closer look at NVMe-oF initiators like Linux NVMe-oF initiator for (surprise) Linux, Chelsio NVMe-oF Initiator for Windows, and StarWind NVMe-oF Initiator for Windows. This very article sheds light on Linux NVMe-oF Initiator + Linux SPDK NVMe-oF Target performance and configuration.

The Toolkit used
To start with, take a look at the schemes of setups that were used for today’s measurements.
Linux SPDK RAM disk NVMe-oF Target <-> Linux NVMe-oF Initiator

Linux SPDK Intel Optane 900P NVMe-oF Target <-> Linux NVMe-oF Initiator

Hosts SPN76 and SPN77 have exactly the same hardware configurations:
- Dell PowerEdge R730, CPU 2x Intel Xeon E5-2683 v3 CPU @ 2.00GHz, RAM 128 GB
- Network: Mellanox Connect x4 100 Gbps
- Storage: Intel Optane 900P (SPN77)
- OS: CentOS 7.6 (Kernel 4.19.34) (Initiator); CentOS 7.6 (Kernel 4.19.34) (Target)
In my today’s setup, SPN76 serves as an initiator and has Linux NVMe-oF Initiator installed on it. SPN77, in turn, is a target (i.e., has Linux SPDK NVMe-oF Target installed). Network bandwidth in this article was measured with rPerf (RDMA connections) and iPerf (TCP).
Measuring Network Bandwidth
To start with, let’s measure network bandwidth between the servers.
Make sure that NIC drivers on both hosts are enabled.
Note: CentOS starting with Kernel 4.19.34 comes with Mellanox drivers preinstalled (i.e., there’s no point in installing them manually). Anyway, here’s how to install Mellanox ConnectX-4 drivers.
##### Run the command below to load Mellanox ConnectX-4 drivers. There will be no annoying messages if the installation process runs smoothly.

modprobe mlx5_core

##### Deploy the command below to make sure that the driver is loaded.

lsmod | grep mlx

##### The output below shows that mlx5_ib (InfiniBand) and mlx5_core drivers have been successfully loaded:

mlx5_ib 167936 0

ib_core 208896 14 ib_iser,ib_cm,rdma_cm,ib_umad,ib_srp,ib_isert,ib_uverbs,rpcrdma,ib_ipoib,iw_cm,mlx5_ib,ib_srpt,ib_ucm,rdma_ucm

mlx5_core 188416 1 mlx5_ib

######
Next, I installed rPerf (https://www.starwindsoftware.com/resource-library/starwind-rperf-rdma-performance-benchmarking-tool) on both servers to check whether NICs in my setup support RDMA and if the whole thing is set up right to do at nice speed. There are two utilities coming in this benchmarking tool: rperf and rping. I need rping first to see whether hosts can talk via RDMA.
Run the utility in the server mode (-s flag) on the initiator (SPN76) server. The -a flag assigns the “server” role to the specific IP:
rping -s -a 172.16.100.76 –v
Deploy rping with the client flag (-c) on the target (SPN77) host. Being run with the -c flag, the client starts talking to the specific IP.
rping -c -a 172.16.100.76 -v
So, with rping configured like that, SPN76 waits for the requests coming from SPN77. Actually, it doesn’t matter after all which host is an initiator and which one is a target: the only thing I need rping for is checking if hosts can talk over RDMA. And, here’s the output if they can.

Now, let’s learn more about Mellanox ConnectX-4 TCP throughput.
You can install iperf with this command:
yum install iperf
Install iperf on both servers. Mark one as a “client” and label another as a “server”. Here’s how installing iperf on the “client” host looked like:
iperf -c 172.16.100.77 -p 911 -P 8 -w 512K -l 2048K -t 180 -i10
Here’s just the same command for installing the utility on the “server” host:
iperf -s -p 911
And, here come the test results.

Let’s measure RDMA network bandwidth now. I used here the same connection scheme as for iperf: one host was labeled as a “server” while another served as a “client”.
./rperf -c -a 172.16.100.77 -C 100000 -S 65536 -o W -q 6 -p 911
RDMA connection bandwidth was measured in 64KB blocks. Here’s the output I got.
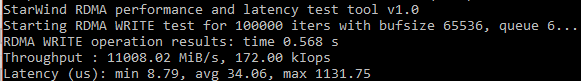
(11008.02*8)/1024=86 Gb/s
Now, let’s measure RDMA performance in 4KB blocks (just in case).
./rperf -c -a 172.16.100.77 -C 100000 -S 4096 -o W -q 6 -p 911
Below, find the output.

(5818.26*8)/1024=45.45 Gb/s
Discussion
The measured network throughput is very close to the expected bandwidth of 100 Gb/s. With RDMA throughput around 86 Gb/s and TCP throughput close to 90Gb/s, I am sure that network will not bottleneck the performance.
Configuring the Target and Initiator
Install nvmecli
First, install nvmecli on both servers.
git clone https://github.com/linux-nvme/nvme-cli.git

cd nvme-cli

make

make install
Start the Initiator on SPN76 and SPN77
modprobe nvme-rdma

modprobe nvme
Setting up RAM disk
You need targetcli (http://linux-iscsi.org/wiki/Targetcli) to create a RAM disk. Here’s how one can install it:
yum install targetcli –y
Run these commands to have targetcli working even after rebooting the host:
systemctl start target

systemctl enable target
Now, using targetcli, create and connect the 1GB RAM disk as a block device.
##### Create the RAM disk using this command:

targetcli /backstores/ramdisk create 1 1G

##### Create loopback mount point (naa.5001*****).

targetcli /loopback/ create naa.500140591cac7a64

##### Then, connect RAM disk to loopback mount point.

targetcli /loopback/naa.500140591cac7a64/luns create /backstores/ramdisk/1
Now, check whether the RAM disk was created using Lsblk. Below, find the output that I got.

RAM disk is presented here as the /dev/sdb directory.
Setting up the Target on SPN77
Download and install SPDK (https://spdk.io/doc/about.html):
git clone https://github.com/spdk/spdk

cd spdk

git submodule update –init

##### Use the command below for automatic installation of the package.

sudo scripts/pkgdep.sh

##### Configure SPDK with RDMA support.

./configure --with-rdma

Make

##### Now, you can start working with SPDK.

sudo scripts/setup.sh
Here’s a configuration retrieved from nvmf.conf (spdk/etc/spdk/).
 - img")
Here’s the config file for Intel Optane 900P benchmarking.

Here are the commands to start the Target:
cd spdk/app/nvmf_tgt
./nvmf_tgt -c ../../etc/spdk/nvmf.conf
Connecting the Initiator to the Target
nvme discover, fittingly, allows detecting the NVMe drives. Let’s take a closer look at the flags: -t rdma narrows the search to devices that support RDMA, -a allows for the host-specific search (just enter the IP), and -s represents the specific port.
nvme discover -t rdma -a 172.16.100.77 -s 4420
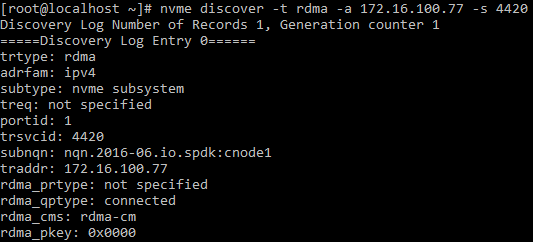
Get the subnqn: nqn.2016-06.io.spdk:cnode1 value and use it with the –n flag (stands for the device name).
nvme connect -t rdma -n nqn.2016-06.io.spdk:cnode1-a 172.16.100.77 -s 4420
If everything is fine, the device will be displayed as NVMe0n1 after running lsblk

How I measured everything here
Well, this is a long article. This being said, it may be good to mention all the measurement steps briefly before I move to the tests.
1. Create the RAM disk using targetcli. This device was connected as a local block device and had its performance measured with FIO. RAM disk performance is a reference, i.e., the maximum performance that can be reached for a RAM disk in this setup.
2. On “server” (SPN77), create the SPDK NVM-oF Target that resides on the RAM disk (in SPDK it is called Malloc). Present this device to the Linux NVMe-oF Initiator that resides on SPN77 over loopback and measure its performance. Compare the observed performance with the RAM disk.
3. Create SPDK NVM-oF Target on the RAM disk that resides on the “server” host, and present it over RDMA to the initiator (SPN76). Benchmark the RAM disk performance over RDMA and compare it to the local RAM disk performance.
4. Hook up an Intel Optane 900P to SPN77 and measure its performance. For further measurements, it will be used as a reference.
5. Next, from SPN77, connect Intel Optane 900P to Linux NVMe-oF Initiator using SPDK NVM-oF Target. Measure disk performance now.
6. Present the drive to Linux NVMe-oF Initiator installed on SPN76. Measure the Intel Optane 900P performance now.
I used FIO (https://github.com/axboe/fio) for measuring RAM disk performance.
There are two ways of how one can install FIO. First, you can just install the utility using the command below:
sudo yum install fio –y
Alternatively, you can install it from the source using this set of commands:
git clone https://github.com/axboe/fio.git

cd fio/

./configure

make && make install
Finding optimal test parameters for benchmarking the RAM disk
Before I move to the real tests, I need to define the optimum test utility settings. In other words, I need to come up with the values for queue depth and the number of threads parameters that ensure the maximum setup performance. For this purpose, I measured the reading performance in 4k blocks under the varying number of threads (numjobs = 1, 2, 4, 8) and rising queue depth (iodepth). Here’s an example of how the listing looked like:
[global]

numjobs=1

loops=1

time_based

ioengine=libaio

direct=1

runtime=60

filename=/dev/sdb

[4k-rnd-read-o1]

bs=4k

iodepth=1

rw=randread

stonewall

[4k-rnd-read-o2]

bs=4k

iodepth=2

rw=randread

stonewall

[4k-rnd-read-o4]

bs=4k

iodepth=4

rw=randread

stonewall

[4k-rnd-read-o8]

bs=4k

iodepth=8

rw=randread

stonewall

[4k-rnd-read-o16]

bs=4k

iodepth=16

rw=randread

stonewall

[4k-rnd-read-o32]

bs=4k

iodepth=32

rw=randread

stonewall

[4k-rnd-read-o64]

bs=4k

iodepth=64

rw=randread

stonewall

[4k-rnd-read-o128]

bs=4k

iodepth=128

rw=randread

stonewall
This being said, let’s move to the results!
Pre-testing the RAM disk
| RAM disk Pre-test (local) | ||||
|---|---|---|---|---|
| 1 Thread | 2 Threads | 4 Threads | 8 Threads | |
| Job name | Total IOPS | Total IOPS | Total IOPS | Total IOPS |
| 4k rnd read 1 Oio | 76643 | 143603 | 252945 | 422235 |
| 4k rnd read 2 Oio | 137375 | 250713 | 370232 | 642717 |
| 4k rnd read 4 Oio | 237949 | 361120 | 626944 | 760285 |
| 4k rnd read 8 Oio | 266837 | 304866 | 654640 | 675861 |
| 4k rnd read 16 Oio | 275301 | 359231 | 635906 | 736538 |
| 4k rnd read 32 Oio | 173942 | 303148 | 652155 | 707239 |
| 4k rnd read 64 Oio | 262701 | 359237 | 653462 | 723969 |
| 4k rnd read 128 Oio | 173718 | 363937 | 655095 | 733124 |
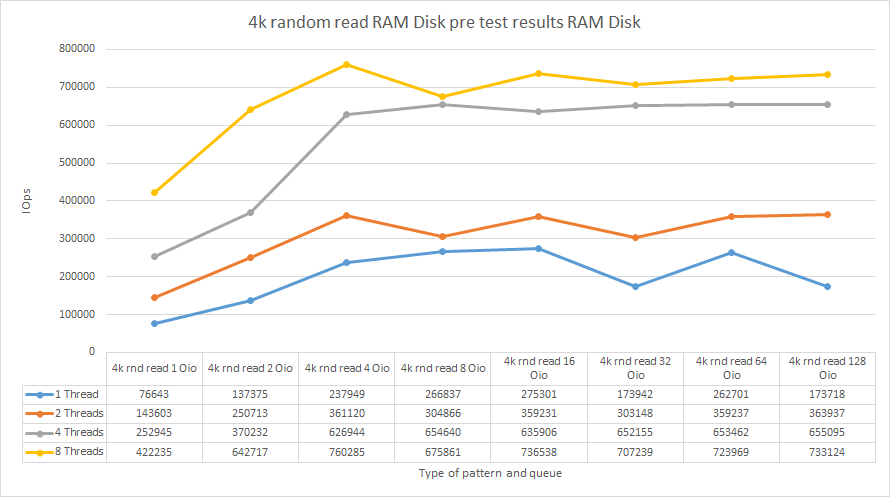
Discussion
Let’s discuss the results now. RAM disk delivers the highest performance under numjobs=8 and iodepth=4. So, I’m going to measure RAM disk performance under these parameters. Here is the listing from FIO file which I used to benchmark RAM disk:
[global]

numjobs=8

iodepth=4

loops=1

time_based

ioengine=libaio

direct=1

runtime=60

filename=/dev/sdb

[4k sequential write]

rw=write

bs=4k

stonewall

[4k random write]

rw=randwrite

bs=4k

stonewall

[64k sequential write]

rw=write

bs=64k

stonewall

[64k random write]

rw=randwrite

bs=64k

stonewall

[4k sequential read]

rw=read

bs=4k

stonewall

[4k random read]

rw=randread

bs=4k

stonewall

[64k sequential read]

rw=read

bs=64k

stonewall

[64k random read]

rw=randread

bs=64k

stonewall

[4k sequential 50write]

rw=write

rwmixread=50

bs=4k

stonewall

[4k random 50write]

rw=randwrite

rwmixread=50

bs=4k

stonewall

[64k sequential 50write]

rw=write

rwmixread=50

bs=64k

stonewall

[64k random 50write]

rw=randwrite

rwmixread=50

bs=64k

stonewall

[8k random 70write]

bs=8k

rwmixread=70

rw=randrw

stonewall
Benchmarking the RAM disk
RAM disk performance (local)
| RAM disk Performance (local) | |||
|---|---|---|---|
| Job name | Total IOPS | Total bandwidth (MB/s) | Average latency (ms) |
| 4k random 50% write | 458958 | 1792.81 | 0.07 |
| 4k random read | 558450 | 2181.45 | 0.05 |
| 4k random write | 460132 | 1797.40 | 0.07 |
| 4k sequential 50% write | 525996 | 2054.68 | 0.06 |
| 4k sequential read | 656666 | 2565.11 | 0.05 |
| 4k sequential write | 520115 | 2031.71 | 0.06 |
| 64k random 50% write | 50641 | 3165.26 | 0.62 |
| 64k random read | 69812 | 4363.57 | 0.45 |
| 64k random write | 50525 | 3158.06 | 0.62 |
| 64k sequential 50% write | 58900 | 3681.56 | 0.53 |
| 64k sequential read | 73434 | 4589.86 | 0.42 |
| 64k sequential write | 57200 | 3575.31 | 0.54 |
| 8k random 70% write | 337332 | 2635.47 | 0.09 |
RAM disk performance (connected via loopback)
| RAM Disk loopback (127.0.0.1) Linux SPDK target | |||
|---|---|---|---|
| Job name | Total IOPS | Total bandwidth (MB/s) | Average latency (ms) |
| 4k random 50write | 709451 | 2771.30 | 0.04 |
| 4k random read | 709439 | 2771.26 | 0.04 |
| 4k random write | 703042 | 2746.27 | 0.04 |
| 4k sequential 50write | 715444 | 2794.71 | 0.04 |
| 4k sequential read | 753439 | 2943.14 | 0.04 |
| 4k sequential write | 713012 | 2785.22 | 0.05 |
| 64k random 50write | 79322 | 4957.85 | 0.39 |
| 64k random read | 103076 | 6442.53 | 0.30 |
| 64k random write | 78188 | 4887.01 | 0.40 |
| 64k sequential 50write | 81830 | 5114.63 | 0.38 |
| 64k sequential read | 131613 | 8226.06 | 0.23 |
| 64k sequential write | 79085 | 4943.10 | 0.39 |
| 8k random 70% write | 465745 | 3638.69 | 0.07 |
RAM disk performance (presented over RDMA)
| RAM disk Performance (SPDK NVMf-oF Target) | |||
|---|---|---|---|
| Job name | Total IOPS | Total bandwidth (MB/s) | Average latency (ms) |
| 4k random 50% write | 764135 | 2984.91 | 0.04 |
| 4k random read | 827150 | 3231.06 | 0.05 |
| 4k random write | 762442 | 2978.30 | 0.04 |
| 4k sequential 50% write | 765172 | 2988.97 | 0.04 |
| 4k sequential read | 826676 | 3229.22 | 0.03 |
| 4k sequential write | 767877 | 2999.54 | 0.04 |
| 64k random 50% write | 80163 | 5010.47 | 0.39 |
| 64k random read | 106989 | 6687.09 | 0.29 |
| 64k random write | 80135 | 5008.57 | 0.39 |
| 64k sequential 50% write | 81582 | 5099.17 | 0.38 |
| 64k sequential read | 114722 | 7170.29 | 0.27 |
| 64k sequential write | 82253 | 5141.09 | 0.38 |
| 8k random 70% write | 513364 | 4010.70 | 0.06 |
Hooking up an NVMe Drive
In this part, I’m going to see what Linux NVMe Target performance is like while being run on Intel Optane 900P.
Setting up the test utility
Before carrying out some actual measurements, I’d like to find the optimum FIO settings. Again, I run the measurements under 4k random read pattern while varying Outstanding IO and number of threads settings. The values associated with the maximum performance are later used as the optimal FIO settings.
| 1 Thread | 2 Threads | 4 Threads | 8 Threads | |
|---|---|---|---|---|
| Job name | Total IOPS | Total IOPS | Total IOPS | Total IOPS |
| 4k rnd read 1 Oio | 45061 | 93018 | 169969 | 329122 |
| 4k rnd read 2 Oio | 90228 | 185013 | 334426 | 528235 |
| 4k rnd read 4 Oio | 206207 | 311442 | 522387 | 587002 |
| 4k rnd read 8 Oio | 146632 | 389886 | 586678 | 586956 |
| 4k rnd read 16 Oio | 233125 | 305204 | 526101 | 571693 |
| 4k rnd read 32 Oio | 144596 | 443912 | 585933 | 584758 |
| 4k rnd read 64 Oio | 232987 | 304255 | 520358 | 586612 |
| 4k rnd read 128 Oio | 146828 | 448596 | 581580 | 580075 |
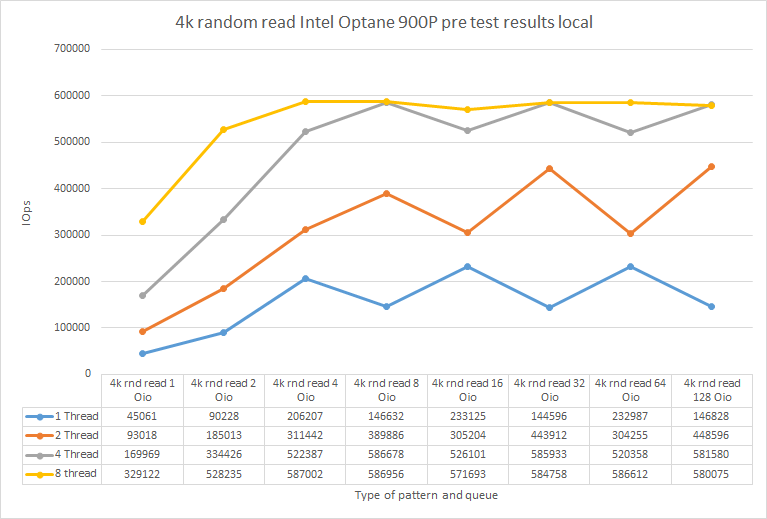
Discussion
According to the plot above, there’s a performance peak under numjobs = 8 and iodepth = 4. So, they are the test utility parameters! It should also be noted that the drive performance observed in my setup perfectly aligns with numbers from Intel’s datasheet: https://ark.intel.com/content/www/us/en/ark/products/123628/intel-optane-ssd-900p-series-280gb-1-2-height-pcie-x4-20nm-3d-xpoint.html.

Can I squeeze all the IOPS out of an Intel Optane 900P?
Intel Optane 900P (local)
| Intel Optane 900P Linux local | |||
|---|---|---|---|
| Job name | Total IOPS | Total bandwidth (MB/s) | Average latency (ms) |
| 4k random 50write | 542776 | 2120.23 | 0.05 |
| 4k random read | 586811 | 2292.24 | 0.05 |
| 4k random write | 526649 | 2057.23 | 0.06 |
| 4k sequential 50write | 323441 | 1263.45 | 0.09 |
| 4k sequential read | 595622 | 2326.66 | 0.05 |
| 4k sequential write | 416667 | 1627.61 | 0.07 |
| 64k random 50write | 34224 | 2139.32 | 0.92 |
| 64k random read | 40697 | 2543.86 | 0.77 |
| 64k random write | 33575 | 2098.76 | 0.94 |
| 64k sequential 50write | 34462 | 2154.10 | 0.91 |
| 64k sequential read | 41369 | 2585.79 | 0.76 |
| 64k sequential write | 34435 | 2152.52 | 0.91 |
| 8k random 70% write | 256307 | 2002.46 | 0.12 |
Intel Optane 900P performance (connected over loopback)
| Intel Optane 900P loopback (127.0.0.1) Linux SPDK NVMe-oF target | |||
|---|---|---|---|
| Job name | Total IOPS | Total bandwidth (MB/s) | Average latency (ms) |
| 4k random 50write | 550744 | 2151.35 | 0.05 |
| 4k random read | 586964 | 2292.84 | 0.05 |
| 4k random write | 550865 | 2151.82 | 0.05 |
| 4k sequential 50write | 509616 | 1990.70 | 0.06 |
| 4k sequential read | 590101 | 2305.09 | 0.05 |
| 4k sequential write | 537876 | 2101.09 | 0.06 |
| 64k random 50write | 34566 | 2160.66 | 0.91 |
| 64k random read | 40733 | 2546.02 | 0.77 |
| 64k random write | 34590 | 2162.01 | 0.91 |
| 64k sequential 50write | 34201 | 2137.77 | 0.92 |
| 64k sequential read | 41418 | 2588.87 | 0.76 |
| 64k sequential write | 34499 | 2156.53 | 0.91 |
| 8k random 70% write | 256435 | 2003.45 | 0.12 |
Intel Optane 900P performance (presented over RDMA)
| Intel Optane 900P SPDK NVMe-oF Target Performance | |||
|---|---|---|---|
| Job name | Total IOPS | Total bandwidth (MB/s) | Average latency (ms) |
| 4k random 50write | 552676 | 2158.90 | 0.05 |
| 4k random read | 587020 | 2293.06 | 0.05 |
| 4k random write | 554338 | 2165.39 | 0.05 |
| 4k sequential 50write | 409980 | 1601.49 | 0.07 |
| 4k sequential read | 592393 | 2314.05 | 0.05 |
| 4k sequential write | 257360 | 1005.33 | 0.12 |
| 64k random 50write | 34592 | 2162.21 | 0.91 |
| 64k random read | 40736 | 2546.28 | 0.77 |
| 64k random write | 34622 | 2164.18 | 0.91 |
| 64k sequential 50write | 33987 | 2124.37 | 0.92 |
| 64k sequential read | 41431 | 2589.68 | 0.76 |
| 64k sequential write | 33979 | 2123.92 | 0.92 |
| 8k random 70% write | 256573 | 2004.52 | 0.12 |
Results
RAM disk
| RAM Disk Linux Local | RAM Disk loopback (127.0.0.1) Linux SPDK NVMe-oF target | RAM Disk on Linux SPDK NVMe-oF Target to Linux Initiator through Mellanox Connect x4 100 Gbps |
|||||||
|---|---|---|---|---|---|---|---|---|---|
| Job name | Total IOPS | Total bandwidth (MB/s) | Average latency (ms) | Total IOPS | Total bandwidth (MB/s) | Average latency (ms) | Total IOPS | Total bandwidth (MB/s) | Average latency (ms) |
| 4k random 50write | 458958 | 1792.81 | 0.07 | 709451 | 2771.30 | 0.04 | 764135 | 2984.91 | 0.04 |
| 4k random read | 558450 | 2181.45 | 0.05 | 709439 | 2771.26 | 0.04 | 827150 | 3231.06 | 0.05 |
| 4k random write | 460132 | 1797.40 | 0.07 | 703042 | 2746.27 | 0.04 | 762442 | 2978.30 | 0.04 |
| 4k sequential 50write | 525996 | 2054.68 | 0.06 | 715444 | 2794.71 | 0.04 | 765172 | 2988.97 | 0.04 |
| 4k sequential read | 656666 | 2565.11 | 0.05 | 753439 | 2943.14 | 0.04 | 826676 | 3229.22 | 0.03 |
| 4k sequential write | 520115 | 2031.71 | 0.06 | 713012 | 2785.22 | 0.05 | 767877 | 2999.54 | 0.04 |
| 64k random 50write | 50641 | 3165.26 | 0.62 | 79322 | 4957.85 | 0.39 | 80163 | 5010.47 | 0.39 |
| 64k random read | 69812 | 4363.57 | 0.45 | 103076 | 6442.53 | 0.30 | 106989 | 6687.09 | 0.29 |
| 64k random write | 50525 | 3158.06 | 0.62 | 78188 | 4887.01 | 0.40 | 80135 | 5008.57 | 0.39 |
| 64k sequential 50write | 58900 | 3681.56 | 0.53 | 81830 | 5114.63 | 0.38 | 81582 | 5099.17 | 0.38 |
| 64k sequential read | 73434 | 4589.86 | 0.42 | 131613 | 8226.06 | 0.23 | 114722 | 7170.29 | 0.27 |
| 64k sequential write | 57200 | 3575.31 | 0.54 | 79085 | 4943.10 | 0.39 | 82253 | 5141.09 | 0.38 |
| 8k random 70% write | 337332 | 2635.47 | 0.09 | 465745 | 3638.69 | 0.07 | 513364 | 4010.70 | 0.06 |
Intel Optane 900P
| Intel Optane 900P Linux local | Intel Optane 900P loopback (127.0.0.1) Linux SPDK NVMe-oF target | Intel Optane 900P on Linux SPDK NVMe-oF Target to Linux Initiator through Mellanox Connect x4 100 Gbps |
|||||||
|---|---|---|---|---|---|---|---|---|---|
| Job name | Total IOPS | Total bandwidth (MB/s) | Average latency (ms) | Total IOPS | Total bandwidth (MB/s) | Average latency (ms) | Total IOPS | Total bandwidth (MB/s) | Average latency (ms) |
| 4k random 50write | 542776 | 2120.23 | 0.05 | 550744 | 2151.35 | 0.05 | 552676 | 2158.90 | 0.05 |
| 4k random read | 586811 | 2292.24 | 0.05 | 586964 | 2292.84 | 0.05 | 587020 | 2293.06 | 0.05 |
| 4k random write | 526649 | 2057.23 | 0.06 | 550865 | 2151.82 | 0.05 | 554338 | 2165.39 | 0.05 |
| 4k sequential 50write | 323441 | 1263.45 | 0.09 | 509616 | 1990.70 | 0.06 | 409980 | 1601.49 | 0.07 |
| 4k sequential read | 595622 | 2326.66 | 0.05 | 590101 | 2305.09 | 0.05 | 592393 | 2314.05 | 0.05 |
| 4k sequential write | 416667 | 1627.61 | 0.07 | 537876 | 2101.09 | 0.06 | 257360 | 1005.33 | 0.12 |
| 64k random 50write | 34224 | 2139.32 | 0.92 | 34566 | 2160.66 | 0.91 | 34592 | 2162.21 | 0.91 |
| 64k random read | 40697 | 2543.86 | 0.77 | 40733 | 2546.02 | 0.77 | 40736 | 2546.28 | 0.77 |
| 64k random write | 33575 | 2098.76 | 0.94 | 34590 | 2162.01 | 0.91 | 34622 | 2164.18 | 0.91 |
| 64k sequential 50write | 34462 | 2154.10 | 0.91 | 34201 | 2137.77 | 0.92 | 33987 | 2124.37 | 0.92 |
| 64k sequential read | 41369 | 2585.79 | 0.76 | 41418 | 2588.87 | 0.76 | 41431 | 2589.68 | 0.76 |
| 64k sequential write | 34435 | 2152.52 | 0.91 | 34499 | 2156.53 | 0.91 | 33979 | 2123.92 | 0.92 |
| 8k random 70% write | 256307 | 2002.46 | 0.12 | 256435 | 2003.45 | 0.12 | 256573 | 2004.52 | 0.12 |


Discussion
First, let’s take a look at data obtained on the RAM disk. Linux SPDK NVMe-oF Target provides 20 000 IOPS gain under all 64KB patterns. Under 4k blocks, things look even better: SPDK Target provides 300 000 IOPS gain.
Now, let’s talk about Intel Optane 900P performance. Under 64k blocks, there’s basically no performance difference between a drive connected locally and one presented over RDMA. Under 4k random write pattern, the PCIe SSD presented over the network was doing even better than one connected locally. Under 4k sequential writes, though, the performance of an NVMe SSD presented over RDMA was significantly lower than when this drive was connected locally.
Wait… What about the latency?
Now, let’s see whether Linux SPDK NVMe-oF Target + Linux Initiator can ensure the lowest latency for the RAM disk and Intel Optane 900P presented over the network. FIO settings: numjobs = 1, iodepth = 1.
RAM disk
| RAM Disk Linux Local | RAM Disk on Linux SPDK NVMe-oF Target to Linux Initiator through Mellanox Connect x4 100 Gbps |
|||||
|---|---|---|---|---|---|---|
| Job name | Total IOPS | Total bandwidth (MB/s) | Average latency (ms) | Total IOPS | Total bandwidth (MB/s) | Average latency (ms) |
| 4k random 50write | 97108 | 379.33 | 0.0069433 | 85115 | 332.48 | 0.0089677 |
| 4k random read | 114417 | 446.94 | 0.0056437 | 82328 | 321.60 | 0.0092321 |
| 4k random write | 95863 | 374.46 | 0.0070643 | 81544 | 318.53 | 0.0093238 |
| 4k sequential 50write | 107010 | 418.01 | 0.0061421 | 87099 | 340.23 | 0.0088669 |
| 4k sequential read | 117168 | 457.69 | 0.0054994 | 83217 | 325.07 | 0.0092358 |
| 4k sequential write | 98065 | 383.07 | 0.0068343 | 84504 | 330.10 | 0.0090527 |
| 64k random 50write | 27901 | 1743.87 | 0.0266555 | 23219 | 1451.25 | 0.0346774 |
| 64k random read | 36098 | 2256.14 | 0.0203593 | 35823 | 2238.99 | 0.0235566 |
| 64k random write | 28455 | 1778.48 | 0.0260830 | 21049 | 1315.59 | 0.0367933 |
| 64k sequential 50write | 28534 | 1783.42 | 0.0262397 | 23753 | 1484.61 | 0.0342470 |
| 64k sequential read | 36727 | 2295.44 | 0.0200747 | 35762 | 2235.17 | 0.0236739 |
| 64k sequential write | 28988 | 1811.78 | 0.0256918 | 24059 | 1503.74 | 0.0341105 |
| 8k random 70% write | 85051 | 664.47 | 0.0083130 | 68362 | 534.09 | 0.0118387 |
Intel Optane 900P
| Intel Optane 900P Linux local | Intel Optane 900P on Linux SPDK NVMe-oF Target to Linux Initiator through Mellanox Connect x4 100 Gbps |
|||||
|---|---|---|---|---|---|---|
| Job name | Total IOPS | Total bandwidth (MB/s) | Average latency (ms) | Total IOPS | Total bandwidth (MB/s) | Average latency (ms) |
| 4k random 50write | 73097 | 285.54 | 0.0108380 | 53664 | 209.63 | 0.0154448 |
| 4k random read | 82615 | 322.72 | 0.0093949 | 54558 | 213.12 | 0.0150121 |
| 4k random write | 73953 | 288.88 | 0.0108047 | 55483 | 216.73 | 0.0151169 |
| 4k sequential 50write | 74555 | 291.23 | 0.0108105 | 52762 | 206.10 | 0.0157316 |
| 4k sequential read | 85858 | 335.39 | 0.0092789 | 53125 | 207.52 | 0.0154067 |
| 4k sequential write | 74998 | 292.96 | 0.0107804 | 56571 | 220.98 | 0.0150328 |
| 64k random 50write | 19119 | 1194.99 | 0.0423029 | 13914 | 869.68 | 0.0602535 |
| 64k random read | 22589 | 1411.87 | 0.0356328 | 17077 | 1067.35 | 0.0482814 |
| 64k random write | 18762 | 1172.63 | 0.0427555 | 13900 | 868.78 | 0.0602887 |
| 64k sequential 50write | 19320 | 1207.54 | 0.0423435 | 13896 | 868.50 | 0.0602752 |
| 64k sequential read | 22927 | 1432.96 | 0.0353837 | 17628 | 1101.79 | 0.0475938 |
| 64k sequential write | 18663 | 1166.44 | 0.0429796 | 13822 | 863.88 | 0.0604900 |
| 8k random 70% write | 72212 | 564.16 | 0.0114044 | 47450 | 370.71 | 0.0184596 |
Conclusion
Today, I measured the performance of Linux NVMe-oF Initiator and Linux SPDK NVMe-oF Target. My next article (https://www.starwindsoftware.com/blog/hyper-v/nvme-part-2-chelsio-nvme-initiator-linux-spdk-nvme-target/) sheds light on Chelsio NVMe-oF Initiator performance.