INTRODUCTION
In this article, I’d like to compare results of the previous two and find out whether SQL Failover Cluster Instance (FCI) can provide you two times higher performance than SQL Server Basic Availability Groups (BAG).
SQL SERVER FCI VS. SQL SERVER BAG
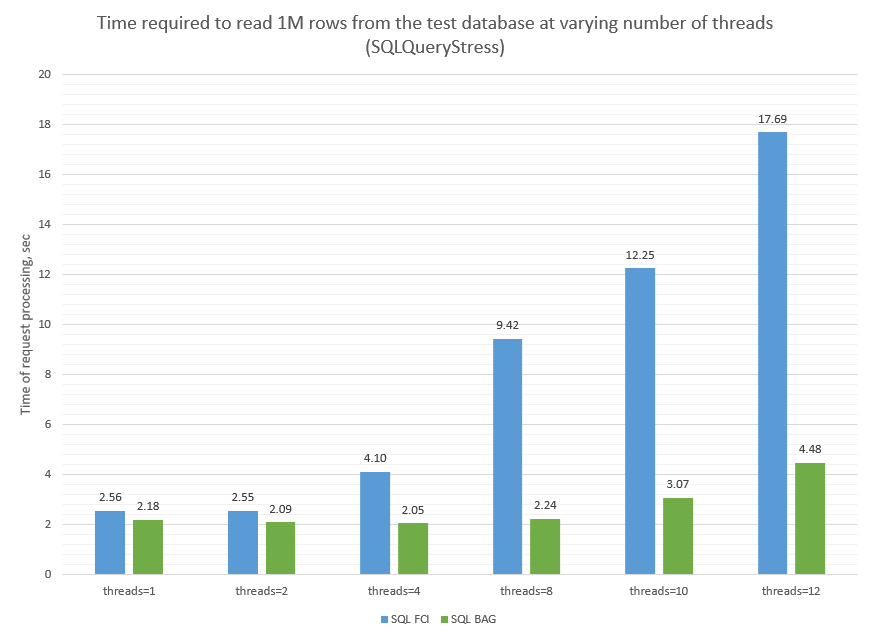
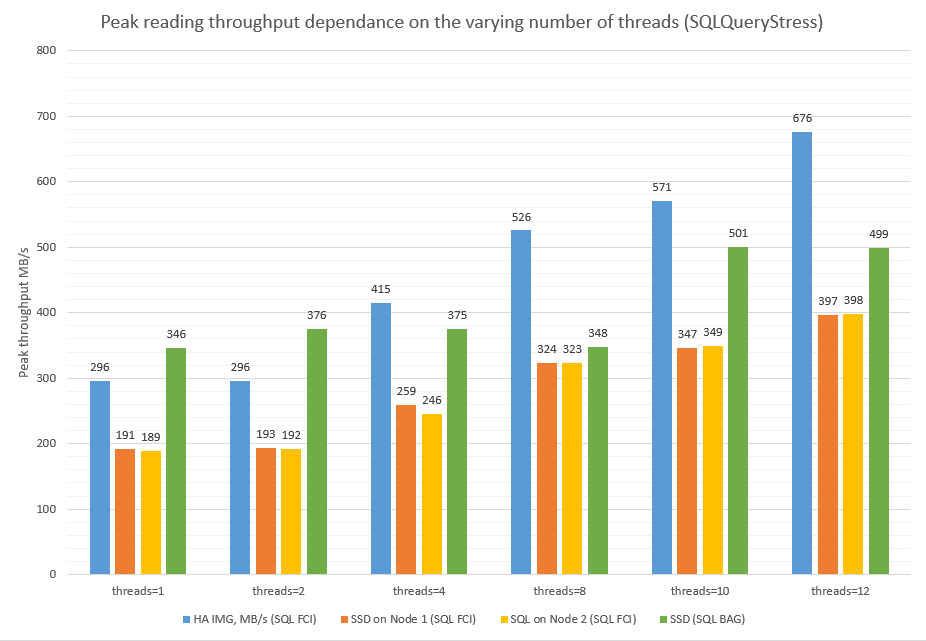
First, let’s sum up how fast SQL Server BAG and SQL Server FCI can cope with reading 1M rows from the database depending on the number of threads.
| Reading 1M table | ||||||
|---|---|---|---|---|---|---|
| SQL FCI | SQL BAG | |||||
| Test run time. sec | HA IMG. MB/s |
SSD (Node 3). MB/s | SSD (Node2). MB/s | test run time. sec |
SSD. MB/s |
|
| threads=1 | 2.56 | 296 | 191 | 189 | 2.18 | 346 |
| threads=2 | 2.55 | 296 | 193 | 192 | 2.09 | 376 |
| threads=4 | 4.10 | 415 | 259 | 246 | 2.05 | 375 |
| threads=8 | 9.42 | 526 | 324 | 323 | 2.24 | 348 |
| threads=10 | 12.25 | 571 | 347 | 349 | 3.07 | 501 |
| threads=12 | 17.69 | 676 | 397 | 398 | 4.48 | 499 |
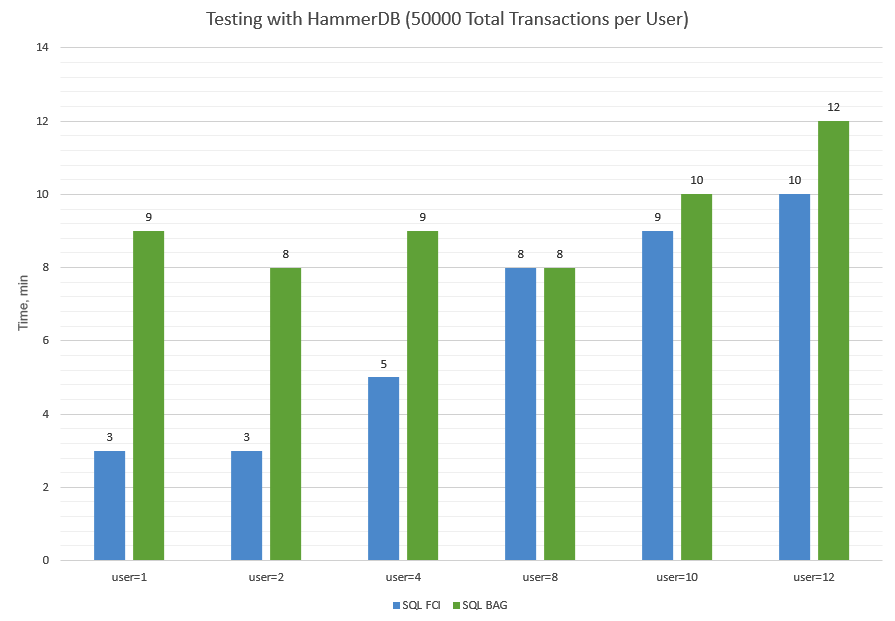
Now, let’s look at how long it takes SQL FCI and SQL BAG to proceed a reading request under a varying number of threads. I got the numbers below with HammerDB at 50000 Total Transactions per User.
| HammerDB (50000 Total Transactions per User) | ||
|---|---|---|
| SQL FCI test run time, min |
SQL BAG test run time, min |
|
| Virtual User=1 | 3 | 9 |
| Virtual User=2 | 3 | 8 |
| Virtual User=4 | 5 | 9 |
| Virtual User=8 | 8 | 8 |
| Virtual User=10 | 9 | 10 |
| Virtual User=12 | 10 | 12 |
DISCUSSION
As I told you before, SQL Server FCI performance tests turned out to be a surprise for me. It took SQL Server FCI 19 seconds to proceed the reading request. It is just as long as for SQL Server BAG! Moreover, while measuring with SQLQeryStress, it took even 3-4 times longer for FCI to cope with this request.
I think that such a weird SQL Server FCI behavior may be caused by StarWind virtual device. Let’s get some proof!
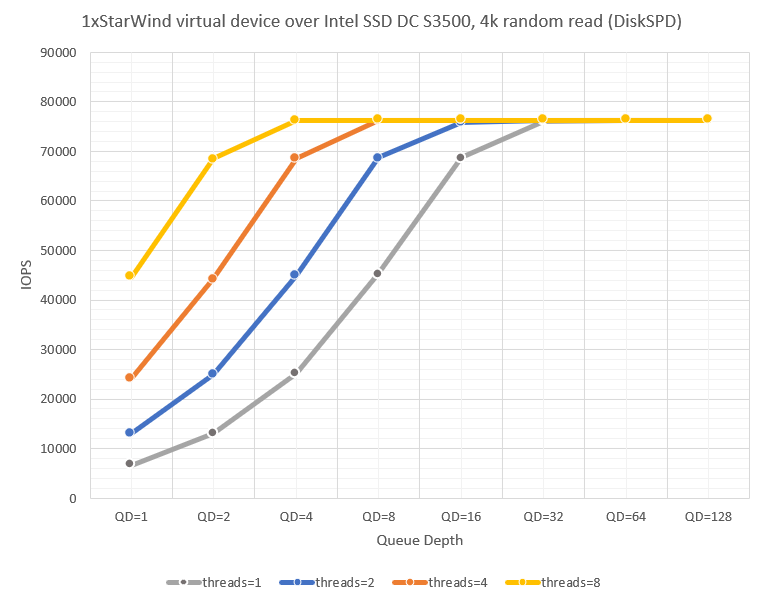
I decided to measure measure StarWind virtual device performance under 4k random read and 8k random read patterns with DiskSPD (version 2.0.21a). I expect performance of two single StarWind virtual devices be twice as high as performance of a single device. Here are DiskSPD launching parameters:
diskspd.exe -t1 -b8k -r -w0 -o1 -d60 -Sh -L #7 > c:\log\t1-o1-8k-rand-read.txt

timeout 10

diskspd.exe -t1 -b8k -r -w0 -o2 -d60 -Sh -L #7 > c:\log\t1-o2-8k-rand-read.txt

timeout 10

diskspd.exe -t1 -b8k -r -w0 -o4 -d60 -Sh -L #7 > c:\log\t1-o4-8k-rand-read.txt

timeout 10

diskspd.exe -t1 -b8k -r -w0 -o8 -d60 -Sh -L #7 > c:\log\t1-o8-8k-rand-read.txt

timeout 10

diskspd.exe -t1 -b8k -r -w0 -o16 -d60 -Sh -L #7 > c:\log\t1-o16-8k-rand-read.txt

timeout 10

diskspd.exe -t1 -b8k -r -w0 -o32 -d60 -Sh -L #7 > c:\log\t1-o32-8k-rand-read.txt

timeout 10

diskspd.exe -t1 -b8k -r -w0 -o64 -d60 -Sh -L #7 > c:\log\t1-o64-8k-rand-read.txt

timeout 10

diskspd.exe -t1 -b8k -r -w0 -o128 -d60 -Sh -L #7 > c:\log\t1-o128-8k-rand-read.txt
Now let’s play with the queue depth a bit! Below, find StarWind virtual device performance under 4k random read and 8k random read patterns at varying queue depth.
| 1xStarWind virtual device over Intel SSD DC S3500. 4k random read (DiskSPD) | ||||||||||||
|---|---|---|---|---|---|---|---|---|---|---|---|---|
| threads=1 | threads=2 | threads=4 | threads=8 | |||||||||
| IOPS | MB/s | Latency (ms) | IOPS | MB/s | Latency (ms) | IOPS | MB/s | Latency (ms) | IOPS | MB/s | Latency (ms) | |
| QD=1 | 6640 | 26 | 0.15 | 12944 | 51 | 0.15 | 24180 | 94 | 0.17 | 44586 | 174 | 0.18 |
| QD=2 | 13044 | 51 | 0.15 | 24874 | 97 | 0.16 | 44295 | 173 | 0.18 | 68478 | 267 | 0.23 |
| QD=4 | 25195 | 98 | 0.16 | 44966 | 176 | 0.18 | 68663 | 268 | 0.23 | 76189 | 298 | 0.42 |
| QD=8 | 45292 | 177 | 0.18 | 68713 | 268 | 0.23 | 76163 | 298 | 0.42 | 76310 | 298 | 0.84 |
| QD=16 | 68758 | 269 | 0.23 | 75838 | 296 | 0.42 | 76317 | 298 | 0.84 | 76300 | 298 | 1.68 |
| QD=32 | 76028 | 297 | 0.42 | 76299 | 298 | 0.84 | 76317 | 298 | 1.68 | 76320 | 298 | 3.35 |
| QD=64 | 76314 | 298 | 0.84 | 76332 | 298 | 1.68 | 76279 | 298 | 3.36 | 76318 | 298 | 6.71 |
| QD=128 | 76335 | 298 | 1.68 | 76335 | 298 | 3.35 | 76313 | 298 | 6.71 | 76311 | 298 | 13.42 |
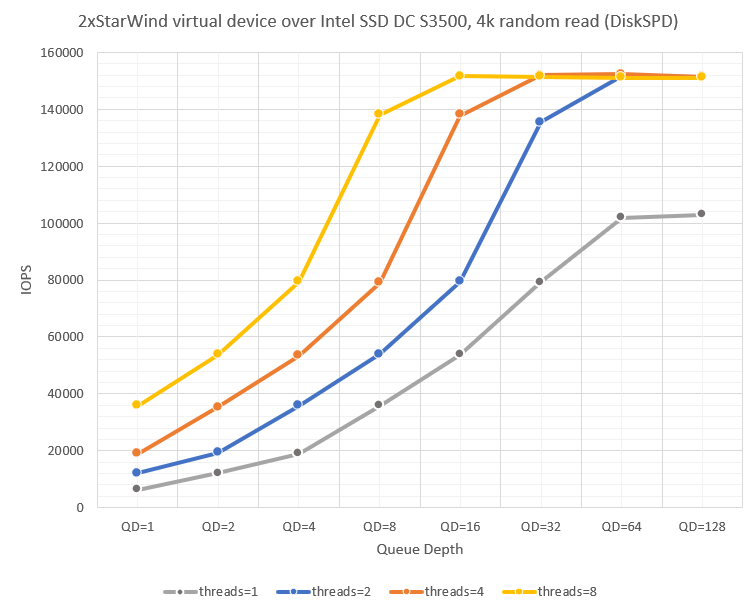
| 2xStarWind virtual device over Intel SSD DC S3500. 4k random read (DiskSPD) | ||||||||||||
|---|---|---|---|---|---|---|---|---|---|---|---|---|
| threads=1 | threads=2 | threads=4 | threads=8 | |||||||||
| IOPS | MB/s | Latency (ms) | IOPS | MB/s | Latency (ms) | IOPS | MB/s | Latency (ms) | IOPS | MB/s | Latency (ms) | |
| QD=1 | 6281 | 25 | 0.16 | 12168 | 48 | 0.16 | 18970 | 74 | 0.21 | 35734 | 140 | 0.22 |
| QD=2 | 12290 | 48 | 0.16 | 19287 | 75 | 0.21 | 35240 | 138 | 0.23 | 53746 | 210 | 0.30 |
| QD=4 | 19029 | 74 | 0.21 | 35832 | 140 | 0.22 | 53335 | 208 | 0.30 | 79282 | 310 | 0.40 |
| QD=8 | 35808 | 140 | 0.22 | 53926 | 211 | 0.30 | 78904 | 308 | 0.41 | 138150 | 540 | 0.46 |
| QD=16 | 53679 | 210 | 0.30 | 79312 | 310 | 0.40 | 137785 | 538 | 0.46 | 151638 | 592 | 0.84 |
| QD=32 | 79175 | 309 | 0.40 | 135433 | 529 | 0.47 | 151961 | 594 | 0.84 | 151447 | 592 | 1.69 |
| QD=64 | 101850 | 398 | 0.63 | 151582 | 592 | 0.84 | 152248 | 595 | 1.68 | 151000 | 590 | 3.39 |
| QD=128 | 103008 | 402 | 1.24 | 151218 | 591 | 1.69 | 151411 | 591 | 3.38 | 150991 | 590 | 6.78 |
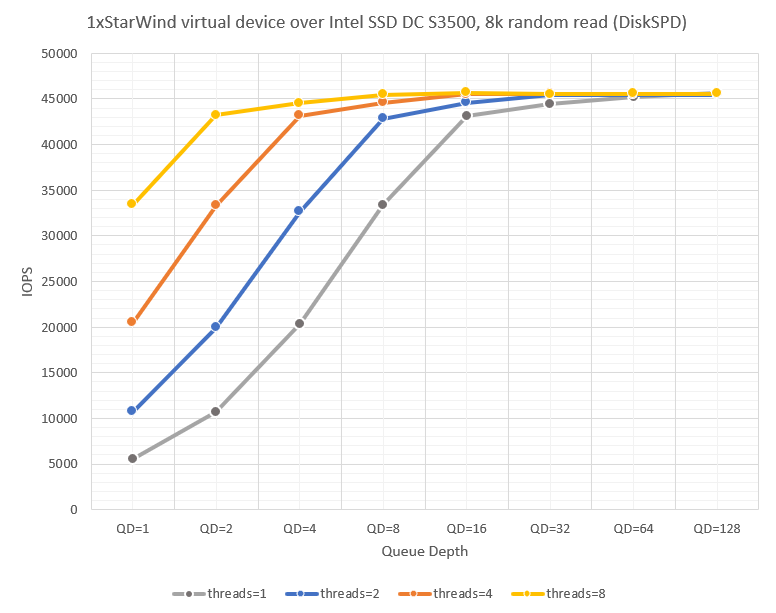
| 1xStarWind virtual device over Intel SSD DC S3500. 8k random read (DiskSPD) | |||||||||||||
|---|---|---|---|---|---|---|---|---|---|---|---|---|---|
| threads=1 | threads=2 | threads=4 | threads=8 | ||||||||||
| IOPS | MB/s | Latency (ms) | IOPS | MB/s | Latency (ms) | IOPS | MB/s | Latency (ms) | IOPS | MB/s | Latency (ms) | ||
| QD=1 | 5594 | 44 | 0.18 | 10711 | 84 | 0.19 | 20495 | 160 | 0.20 | 33412 | 261 | 0.24 | |
| QD=2 | 10726 | 84 | 0.19 | 19915 | 156 | 0.20 | 33277 | 260 | 0.24 | 43202 | 338 | 0.37 | |
| QD=4 | 20311 | 159 | 0.20 | 32639 | 255 | 0.25 | 43158 | 337 | 0.37 | 44552 | 348 | 0.72 | |
| QD=8 | 33359 | 261 | 0.24 | 42826 | 335 | 0.37 | 44572 | 348 | 0.72 | 45477 | 355 | 1.41 | |
| QD=16 | 43187 | 337 | 0.37 | 44576 | 348 | 0.72 | 45523 | 356 | 1.41 | 45683 | 357 | 2.80 | |
| QD=32 | 44503 | 348 | 0.72 | 45466 | 355 | 1.41 | 45573 | 356 | 2.81 | 45529 | 356 | 5.62 | |
| QD=64 | 45183 | 353 | 1.42 | 45474 | 355 | 2.82 | 45517 | 356 | 5.62 | 45576 | 356 | 11.23 | |
| QD=128 | 45625 | 356 | 2.81 | 45473 | 355 | 5.63 | 45586 | 356 | 11.23 | 45572 | 356 | 22.47 | |
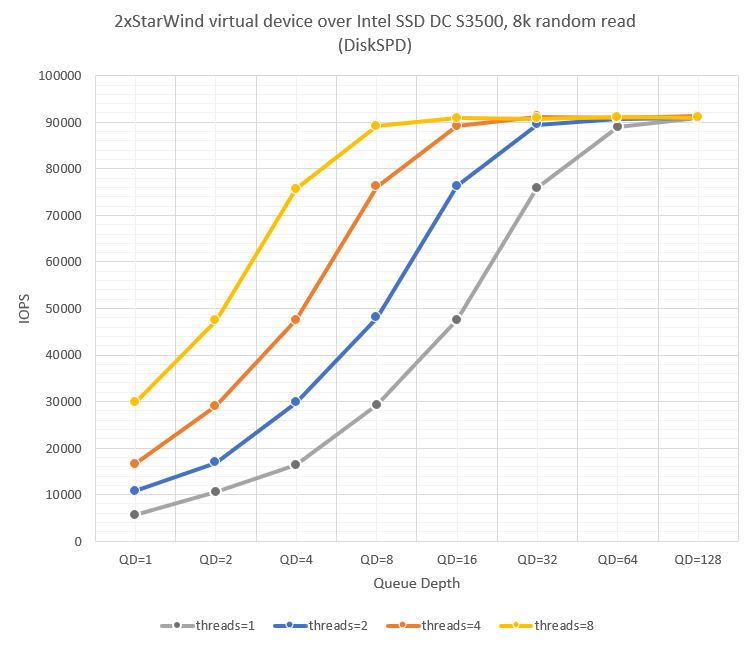
| 2xStarWind virtual device over Intel SSD DC S3500. 8k random read (DiskSPD) | ||||||||||||
|---|---|---|---|---|---|---|---|---|---|---|---|---|
| threads=1 | threads=2 | threads=4 | threads=8 | |||||||||
| IOPS | MB/s | Latency (ms) | IOPS | MB/s | Latency (ms) | IOPS | MB/s | Latency (ms) | IOPS | MB/s | Latency (ms) | |
| QD=1 | 5537 | 43 | 0.18 | 10756 | 84 | 0.19 | 16555 | 129 | 0.24 | 29741 | 232 | 0.27 |
| QD=2 | 10658 | 83 | 0.19 | 16882 | 132 | 0.24 | 28975 | 226 | 0.28 | 47339 | 370 | 0.34 |
| QD=4 | 16431 | 128 | 0.24 | 29717 | 232 | 0.27 | 47441 | 371 | 0.34 | 75624 | 591 | 0.42 |
| QD=8 | 29206 | 228 | 0.27 | 48022 | 375 | 0.33 | 76203 | 595 | 0.42 | 89124 | 696 | 0.72 |
| QD=16 | 47434 | 371 | 0.34 | 76240 | 596 | 0.42 | 89118 | 696 | 0.72 | 90905 | 710 | 1.41 |
| QD=32 | 75783 | 592 | 0.42 | 89444 | 699 | 0.72 | 91153 | 712 | 1.40 | 90763 | 709 | 2.82 |
| QD=64 | 88979 | 695 | 0.72 | 90781 | 709 | 1.41 | 90827 | 710 | 2.82 | 91096 | 712 | 5.62 |
| QD=128 | 90938 | 710 | 1.41 | 90904 | 710 | 2.82 | 91304 | 713 | 5.61 | 90938 | 710 | 11.26 |
CONCLUSION
Let’s sum up all the measurements that I presented today. 2 StarWind virtual devices do perform twice better than one. This means that running a StarWind virtual device over an SSD disk lets you get more of its performance. This being said, StarWind virtual disk should not limit reading from a SQL Server FCI database.
Although, if you look carefully at the measurements one more time, you may arrive at the conclusion that StarWind virtual device performance doubles only after specific queue depth value. Let me show you what I’m trying to say. You get 76163 IOPS at 4k random read pattern under threads = 4 and QD = 8. This is actually the underlying storage performance claimed by Intel. 2 StarWind virtual devices show mere 78904 IOPS under the same conditions. You see, there’s no performance doubling. Besides, you observe StarWind virtual device performance doubling for QD=32 (under the same number of threads) and higher. This may be the reason why you do not see the expected performance gain for SQL Server FCI that has the database on StarWind virtual device.
Anyway, I have achieved what I expected: SQL Server FCI has 2 times higher performance if its database resides on SSD than SQL Server BAG under the same conditions.