
Introduction
StarWind has just announced that GRAID SupremeRAID™ – the world’s first NVMe-oF RAID card – has become part of its StarWind All-NVMe Backup Appliance. However, to better understand why it’s such a big deal and what the implications of the cutting-edge GRAID technology are, we first need some context.
Everybody knows that even though not a backup solution per se, RAID technology is quite regularly used on servers recording data backups. For decades RAID arrays have been used to protect data from failure. After all, while you were working with HDD, a single RAID card is pretty much enough since you couldn’t have probably gotten more I/O than it could’ve handled. However, despite once being an uncommon option, NVMe SSDs have become the new black. Now, these can deliver around one million IOPS per single card, which is why trying to handle one using traditional RAID system configuration will probably result in the most massive performance bottleneck you have ever seen.
That’s why the situation is quite ironic. While the NVMe SSDs can reach the highest performance levels possible today, there is just no way to secure them with a shared storage environment. Hardware options (RAID controller) are limited to a few disks maximum, and software alternatives can’t reach the top of NVMe’s potential performance either. From the looks of it, it seems that this is one of those cases when you can’t have your cake and eat it too. Enterprises and businesses now face a less than pleasant situation since there’s no possibility to tap into the full potential of the NVMe SSD performance without sacrificing their data security in exchange. Or is there?
StarWind SAN & NAS is designed to enable you with repurposing the existing hardware running industry-standard hypervisor into high-performing storage. Essentially, it turns the server with internal storage into a redundant storage array presented as NAS or SAN. Of course, a regular RAID array still can’t match the NVMe performance, but GRAID Technology SupremeRAID™ SR-1000 surely does.
The world’s first NVMe RAID card to deliver maximum available NVMe SSD performance is a plug & play solution with Software-Composable Infrastructure (SCI) that provides you with high performance and removes performance bottlenecks altogether. A working Backup Appliance configuration with GRAID Technology over StarWind SAN & NAS can arrange your NVMe into shared storage while you’re enjoying the highest level of IOPS and throughput you can get.
Purpose
Assembling a working Backup Appliance prototype based on StarWind SAN&NAS is only half of the job. Our primary goal here is to benchmark this prototype’s performance for different scenarios with the best hardware we can get. Within the scenario for SMB, the backup repository is presented as an SMB share. In the case of iSCSI, it’s a disk connected via iSCSi protocol to the VM containing Veeam Backup & Replication (VBR). As for the Linux node, the backup repository is presented as a catalog on the remote Linux host (in this here case, it’s StarWind SAN&NAS, obviously).
Benchmarking Methodology, Details & Results
The VM with StarWind SAN&NAS, containing 5 NVMe (Intel Optane SSD DC P5800X) and GPU NVIDIA Quadro T1000, has been transferred to the backup-node. Thanks to GRAID NVMe, these were arranged into the RAID5 array, which will serve as the backup repository. Furthermore, 2 VMFS datastores were built over 2 NVMe (Intel Optane SSD DC P5800X) on the compute-node to contain VMs for backup/restore operations. We are going to use Veeam Backup & Replication as a backup solution (VM containing Veeam Backup & Replication has been deployed on the compute-node). ESXi hosts, VBR VM, and StarWind SAN&NAS VM connect with each other within the 100GbE network.
Testbed:

VM with VBR:
For the backup/restore operations, VBR uses the Backup Proxy role. This one is installed by default along with the VBR, but you can additionally deploy/transfer it to the other VMs, if necessary. VM with the Backup Proxy role should be deployed on the ESXi hosts with direct access to the ESXi datastores within which we plan to perform our backup/restore operations (here it’s the compute-node and DS Optane – 01,02). Thanks to this, we were able to use the “hotadd” technology instead of “nbd” and reduce restoration time by 5 times. Since the chosen scenario doesn’t require us to use the additional VM for the Backup Proxy role, the VM with VBR goes straight to the compute-node.
“hotadd” & “nbd”:
If the Backup Proxy role is on the backup-node, “nbd” is used. Restoration time – 335MB\s.

If the Backup Proxy role is on the compute-node, “hotadd” is used. Restoration time – 2GB\s.

Benchmarking Methodology:
For all three configurations, we are going to measure the performance time for the following operations:
Backup:
- 1 VM – 1 backup job;
- 10 VMs – 1 backup job;
- 10 VMs – 10 backup jobs;
Restore:
- 1 VM;
- 10 VMs simultaneously;
Instant recovery:
- 1 VM (time from the beginning of the job to the downloading of the VM into the Login screen);
For benchmarking, there will be used 10 identical VMs with Windows Server 2019 and 50GB virtual disk:

To get the information about the throughput, we are disabling deduplication, compression, etc:

Testbed architecture overview:
Hosts’ parameters:
Compute-node
| Supermicro (SYS-220U-TNR) | |
|---|---|
| CPU | Intel(R) Xeon(R) Platinum 8352Y @2.2GHz |
| Sockets | 2 |
| Cores/Threads | 64/128 |
| RAM | 256Gb |
| Storage | 2x Intel® Optane™ SSD DC P5800X Series (400GB) |
| NICs | 1x ConnectX®-5 EN 100GbE (MCX516A-CDAT) |
| OS | VMware ESXi, 7.0.3, 18644231 |
Backup-node
| Supermicro (SYS-220U-TNR) | |
|---|---|
| CPU | Intel(R) Xeon(R) Platinum 8352Y @2.2GHz |
| Sockets | 2 |
| Cores/Threads | 64/128 |
| RAM | 256Gb |
| Storage | 5x Intel® Optane™ SSD DC P5800X Series (400GB) |
| GPU | 1x Nvidia quadro T1000 |
| NICs | 1x ConnectX®-5 EN 100GbE (MCX516A-CDAT) |
| OS | VMware ESXi, 7.0.3, 18644231 |
VMs’ parameters:
| StarWind SAN&NAS | |
|---|---|
| vCPU | 16 |
| RAM | 16 |
| OS | Ubuntu 20.04.1 LTS |
| GRAID | 1.0.6-126 |
| Samba | 4.13.14 |
| Veeam Backup & Replication | |
|---|---|
| vCPU | 16 |
| RAM | 16 |
| OS | Windows Server 2019 |
| VBR | 11.0.1.1276 |
Benchmark results:
For starters, let’s establish the performance of the storage wherein the backups will be stored:
| 1 NVMe RAW | GRAID raid5 (5 NVMe) RAW | Comparison | |||||||||||
| pattern | numjobs | iodepth | IOPs | MiB\s | lat (ms) | numjobs | iodepth | IOPs | MiB\s | lat (ms) | IOPs | MB\s | lat (ms) |
| read 1M | 1 | 2 | 7034 | 7034 | 0,28 | 1 | 4 | 13500 | 13414 | 0,30 | 191,92% | 190,71% | 104,23% |
| 1 | 8 | 21900 | 21914 | 0,36 | 311,34% | 311,54% | 128,17% | ||||||
| 1 | 16 | 27400 | 27443 | 0,58 | 389,54% | 390,15% | 205,28% | ||||||
| write 1M | 1 | 2 | 4730 | 4730 | 0,42 | 1 | 4 | 3296 | 3296 | 1,21 | 69,68% | 69,68% | 287,20% |
| 1 | 8 | 4788 | 4788 | 1,67 | 101,23% | 101,23% | 395,73% | ||||||
| 1 | 16 | 4787 | 4787 | 3,34 | 101,21% | 101,21% | 791,47% | ||||||
| GRAID raid5 (5 NVMe) RAW | GRAID raid5 (5 NVMe) + XFS | Comparison | |||||||||
|---|---|---|---|---|---|---|---|---|---|---|---|
| pattern | numjobs | iodepth | IOPs | MiB\s | lat (ms) | IOPs | MiB\s | lat (ms) | IOPs | MB\s | lat (ms) |
| read 1M | 1 | 4 | 13500 | 13414 | 0,30 | 13300 | 13312 | 0,30 | 98,52% | 99,24% | 101,01% |
| 1 | 8 | 21900 | 21914 | 0,36 | 21700 | 21709 | 0,37 | 99,09% | 99,07% | 101,10% | |
| 1 | 16 | 27400 | 27443 | 0,58 | 27300 | 27238 | 0,59 | 99,64% | 99,25% | 100,51% | |
| write 1M | 1 | 4 | 3296 | 3296 | 1,21 | 2699 | 2699 | 1,48 | 81,89% | 81,89% | 122,11% |
| 1 | 8 | 4788 | 4788 | 1,67 | 3821 | 3821 | 2,09 | 79,80% | 79,80% | 125,27% | |
| 1 | 16 | 4787 | 4787 | 3,34 | 4656 | 4656 | 3,44 | 97,26% | 97,26% | 102,84% | |
Backup:
For all three scenarios, we are going to benchmark the Duration parameter (in the case with 10 jobs, the average value will be applied):
| 1 VM – 1 Job | SMB | iSCSI | Linux node |
|---|---|---|---|
| Duration: | 0:02:47 | 0:03:07 | 0:02:33 |
StarWind SAN&NAS storage usage:

We can see for ourselves that even though, in the case with SMB, the storage is facing a bigger load, duration also drops by 12 sec compared to the Linux node and 51 sec compared to the iSCSi. Nevertheless, the time required per 1 job for SMB is 14 sec longer than for Linux and only 20 sec less than for iSCSI.
| 10 VMs – 1 Job | SMB | iSCSI | Linux node |
|---|---|---|---|
| Duration: | 0:11:16 | 0:18:31 | 0:10:15 |
StarWind SAN&NAS storage :

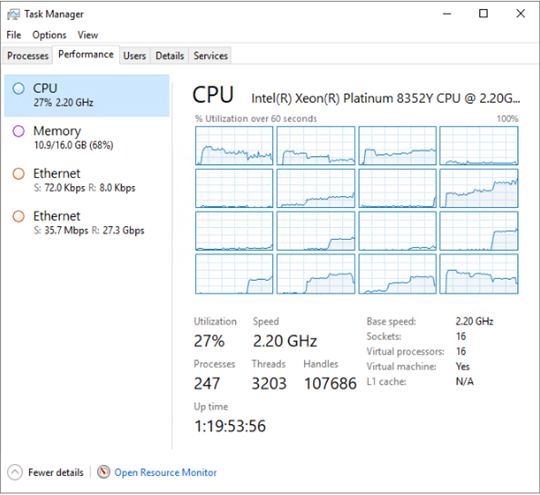
SMB – CPU usage:
VBR VM:

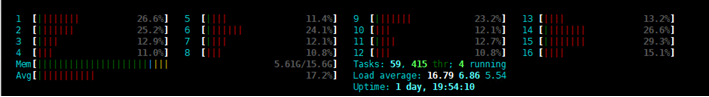
StarWind SAN&NAS VM:

iSCSI – CPU usage:
VBR VM:

StarWind SAN&NAS VM:

Linux node – CPU usage:
VBR VM:

StarWind SAN&NAS VM:

| 10 VMs – 10 Jobs | SMB | iSCSI | Linux node |
|---|---|---|---|
| Duration (avg): | 0:04:57 | 0:05:22 | 0:04:19 |
StarWind SAN&NAS storage usage:

SMB – CPU usage:
VBR VM:

StarWind SAN&NAS VM:

iSCSI – CPU usage:
VBR VM:

StarWind SAN&NAS VM:

Linux node – CPU usage:
VBR VM:

StarWind SAN&NAS VM:

Admittedly, while the Linux node scenario appears to be the fastest, the iSCSI scenario seems to be the slowest one. Nothing is surprising about it, though, since in the case with the Linux node we are dealing with the minimal number of additional “layers”, while for the iSCSI the opposite is true. As you can see for yourself from the screenshots, the Linux configuration requires the most CPU resources of all.
Restore:
For all three scenarios, we are going to benchmark the Processing duration parameter (in the case with 10 jobs, the average value will be applied):
| 1 VM | SMB | iSCSI | Linux node |
|---|---|---|---|
| Processing duration: | 0:01:42 | 0:01:41 | 0:01:44 |
StarWind SAN&NAS storage usage:

| 10 VMs | SMB | iSCSI | Linux node |
|---|---|---|---|
| Processing duration (avg): | 0:03:44 | 0:04:04 | 0:03:53 |

SMB – CPU usage:
VBR VM:

StarWind SAN&NAS VM:

iSCSI – CPU usage:
VBR VM:
StarWind SAN&NAS VM:
Linux node – CPU usage:
VBR VM:

StarWind SAN&NAS VM:
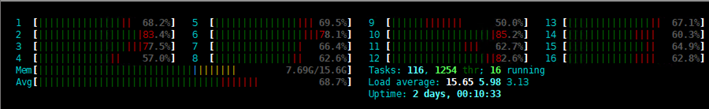
Apparently, the results are more or less the same for each scenario involved, but in the case with the Linux node, the CPU load is 2-2,5 times higher.
Instant recovery:
Time from the beginning of the job to the booting VM into the Login screen:
| 1 VM | SMB | iSCSI | Linux node |
|---|---|---|---|
| Duration: | 0:00:59 | 0:00:54 | 0:00:54 |
The results are more or less the same for each scenario involved.
Conclusion
Well, all in all, the last results can pretty much sum it up: the Backup Appliance with GRAID based on StarWind SAN & NAS works well in all three scenarios presented. Naturally, the numbers are different in each individual case. In general, though, the slight performance differences are caused by the specifics of each scenario rather than by the solution itself. For instance, the Linux node scenario needs the biggest chunk of CPU resources, while the iSCSI scenario takes the longest to get the job done. Overall, the benchmarking in all three cases has shown satisfactory results, proving indeed that this configuration can become a real life-saver for those who don’t want to waste their money on unnecessary proprietary hardware.