

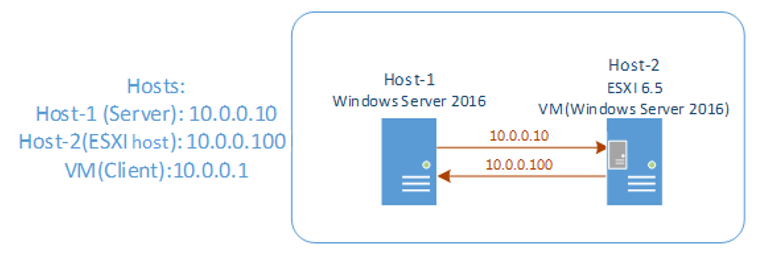
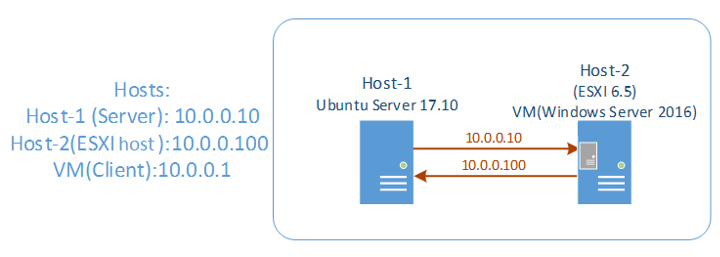
For all tests, I’ve used the guest VM created on the ESXi hypervisor as a client.
Again, keep in mind our environment configuration:
Host 1
- Intel Xeon E5-2670 v4
- 128GB RAM Kingston
- 1x HDD Seagate 1TB
- 4xIntel DC S3610 Series 480GB
- Mellanox ConnectX-3 network adapter 10GbE
Host 2
- Intel Xeon E5-2670 v4
- 128GB RAM Kingston
- 1x HDD Seagate 1TB
- Mellanox ConnectX-3 network adapter 10GbE
Testing tools
For measuring NFS and iSCSI performance, I’ve used two instruments: DiskSpd v2.0.17 and FIO v3.4.
In order to squeeze the maximum performance out of our SSD during benchmarks, I’ve measured the optimal load parameters for FIO and DiskSpd, such as the number of threads and outstanding I/O value.
The primary test indicated that with FIO and DiskSpd, the maximum SSD performance can be achieved under 8 threads and outstanding I/O value 4. Therefore, I’ll hold all further tests under these launching parameters for these utilities.
Let’s get into a bit more details on our testing tools.
DiskSpd is a really handy instrument for testing storage. Reliable and precise workload measurement and flexible parameters – basically, it has all you need for synthetic storage subsystem testing and validation.
For running benchmarks with DiskSpd, I’ve used the following commands:
- exe -t8 -Z1M -b4K -r -w0 -a0,2,4,6,8,10,12,14 -o4 -h -L -d180 -W60 #1 > c:\DSPD\4k_random_read.txt
- exe -t8 -Z1M -b4K -r -w100 -a0,2,4,6,8,10,12,14 -o4 -h -L -d180 -W60 #1 > c:\DSPD\4k_random_write.txt
- exe -t8 -Z1M -si -b64K -w0 -a0,2,4,6,8,10,12,14 -o4 -h -L -d180 -W60 #1 > c:\DSPD\64k_seq_read.txt
- exe -t8 -Z1M -si -b64K -w100 -a0,2,4,6,8,10,12,14 -o4 -h -L -d180 -W60 #1 > c:\DSPD\64k_seq_write.txt
- exe -t8 -Z1M -b8K -r -w30 -a0,2,4,6,8,10,12,14 -o4 -h -L -d180 -W60 #1 > c:\DSPD\8k_50-50_rand-seq_R70-W30_write.txt
As to FIO, it’s a well-known tool used for testing the performance of storage systems. It’s a cross-platform utility with an open source code – FIO scores!
Depending on the OS used in the test, you have to choose a proper input/output driver:
- For Windows: ioengine=windowsaio
- For Linux: Linux: ioengine=libaio
For running tests with FIO, I’ve used the following parameters:
[global]
loops=1
time_based
ramp_time=60
runtime=180
direct=1
ioengine=windowsaio
cpus_allowed=0,2,4,6,8,10,12,14
filename=\\.\PhysicalDrive1
[4k 100%random 100% read]
rw=randread
bs=4k
numjobs=8
iodepth=4
stonewall
[4k 100%random 100% write]
rw=randwrite
bs=4k
numjobs=8
iodepth=4
stonewall
[64k 100%seq 100% read]
rw=read
bs=64k
numjobs=8
iodepth=4
stonewall
[64k 100%seq 100% write]
rw=write
bs=64k
numjobs=8
iodepth=4
stonewall
[8k 50/50 Random/seq 70/30 Read/Write]
rwmixread=70
rw=rw
bs=8k
numjobs=4
iodepth=2
[8k 50/50 Random/seq 70/30 Read/Write]
rwmixread=70
rw=randrw
bs=8k
numjobs=4
iodepth=2
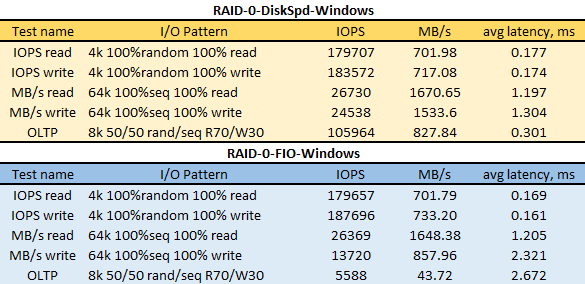
Testing RAID
Prior to evaluation, I’ve built RAID-0 on the server (Host 1) out of 4xIntel DC S3610 Series 480GB and measured the initial performance of the underlying storage. Here are the results:
I’ve performed all further tests inside the ESXi VM (Windows Server 2016).
Take a look at the VM parameters:
- 32 CPU, сore per socket – 1;
- 8 GB Memory;
- 1 disk – 35GB.
The CPU parameters and memory for VMs when connecting the NFS share and the iSCSI target remained the same.
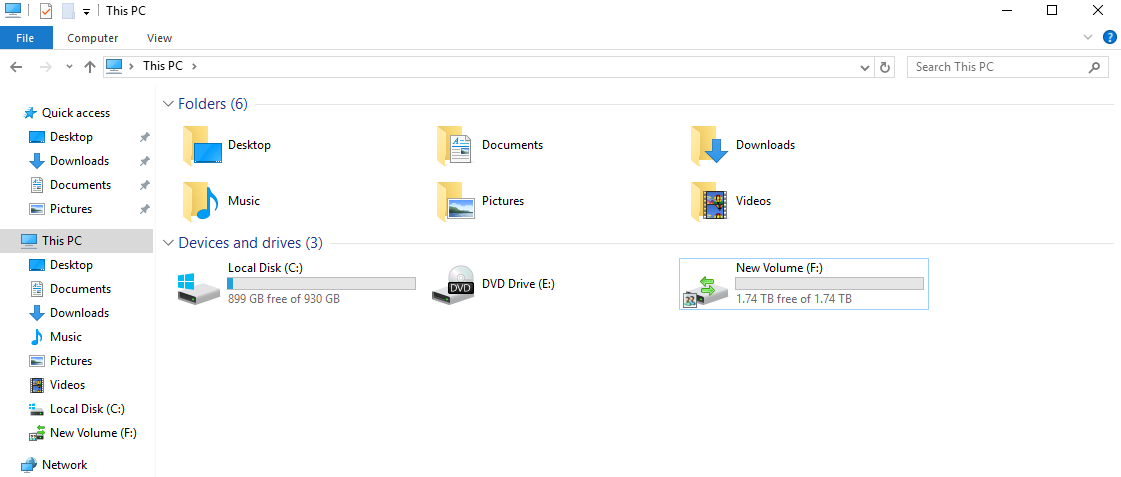
Preparing the VM for NFS testing
In order to evaluate the NFS performance, I’ve deployed the NFS server on Host 1. The NFS share was created on top of RAID-0 disk array. You can see it in the image below as Disk F with 1,74TB:
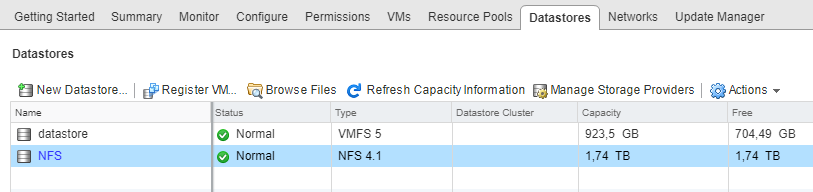
On Host 2 (ESXi host), I’ve created a new NFS Datastore backed by the previously created NFS share on Host 1:
Next, in the VM, I’ve created a new disk in NFS Datastore with disk size equaling the Datastore capacity.
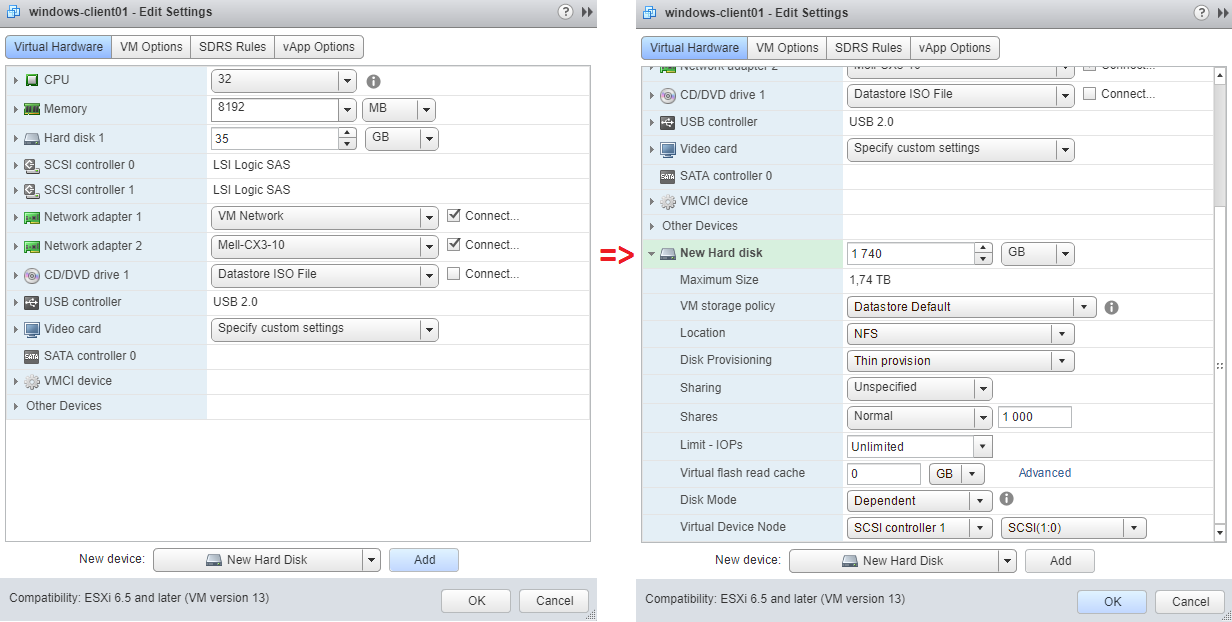
When connecting the NFS disk to the VM, the only possible virtual disk provisioning policy you can choose is Thin Provision.
To get more info about virtual disk provisioning policies, check the VMware official website: https://pubs.vmware.com/vsphere-51/index.jsp?topic=%2Fcom.vmware.vsphere.vm_admin.doc%2FGUID-4C0F4D73-82F2-4B81-8AA7-1DD752A8A5AC.html
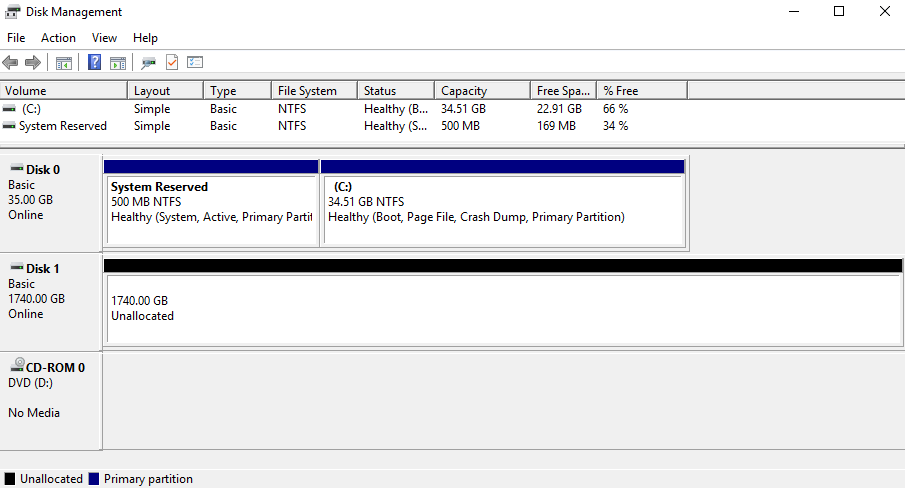
So, after applying all the configurations and turning the VM on, you can see that the connected disk has been successfully identified:
Preparing the VM for iSCSI testing
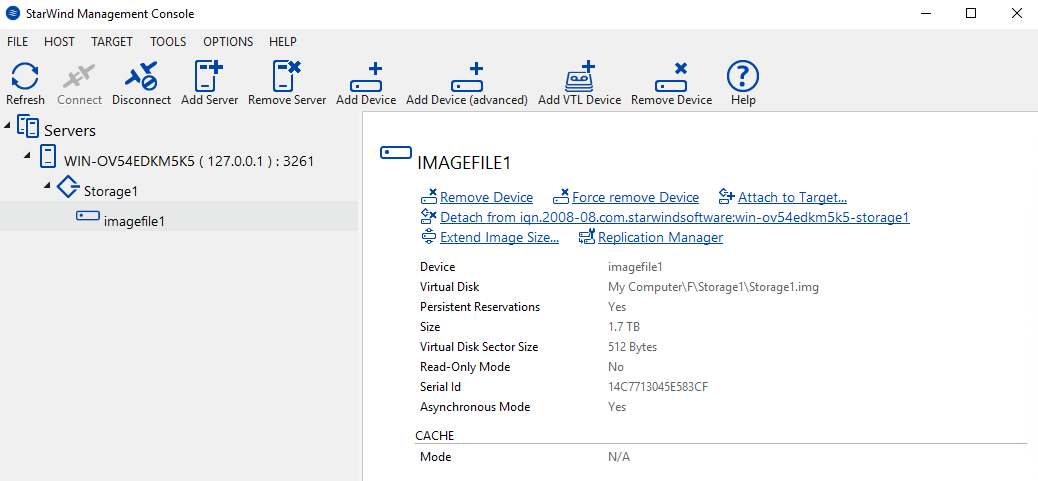
In order to test iSCSI, I’ve installed StarWind VSAN on Host-1 and created a device with 1,7TB storage without a cache memory.
Free version VSAN: https://www.starwindsoftware.com/starwind-virtual-san-free
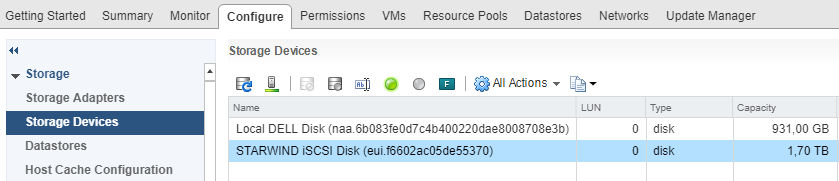
To identify StarWind iSCSI Disk, in VMware, you need to go to Host=> Configure => Storage Devices and perform Storage Rescan.
In the VM settings, I’ve added StarWind iSCSI disk as RDM Disk.
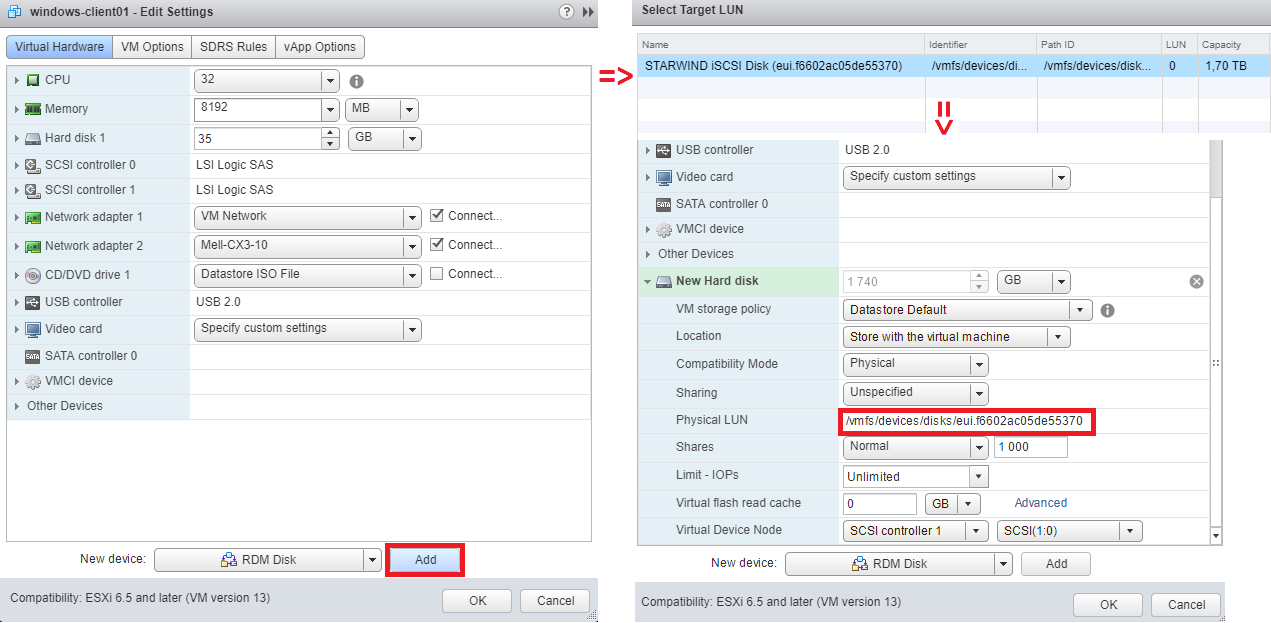
If you need more details on Raw Disk Mapping, please go to VMware official website by following this link: https://pubs.vmware.com/vsphere-4-esx-vcenter/index.jsp?topic=/com.vmware.vsphere.server_configclassic.doc_40/esx_server_config/raw_device_mapping/c_about_raw_device_mapping.html
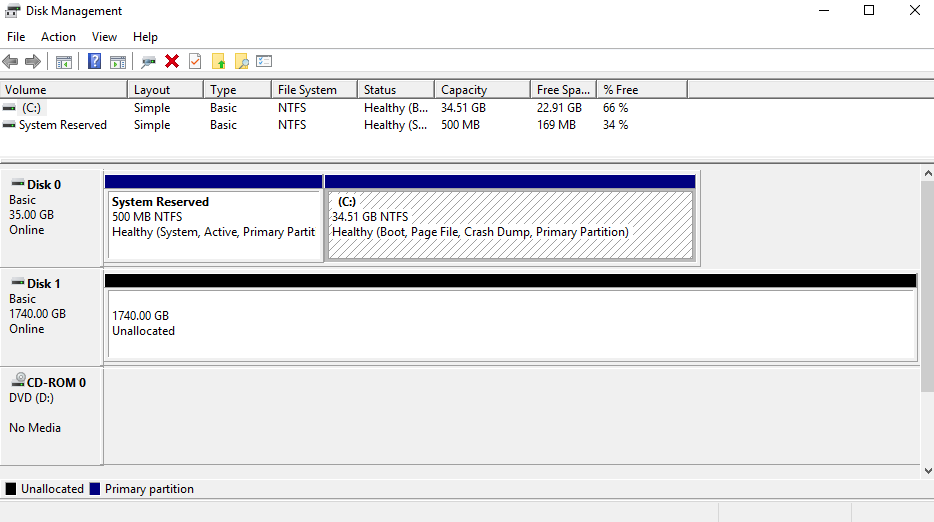
After applying all the configurations and turning on the VM, the connected disk has been successfully identified:
Comparing VM CPU workload during NFS and iSCSI testing
To compare the virtual machine CPU workload, I’ve tested NFS and iSCSI under 4k random read pattern using DiskSpd. You can see the results in the image below.
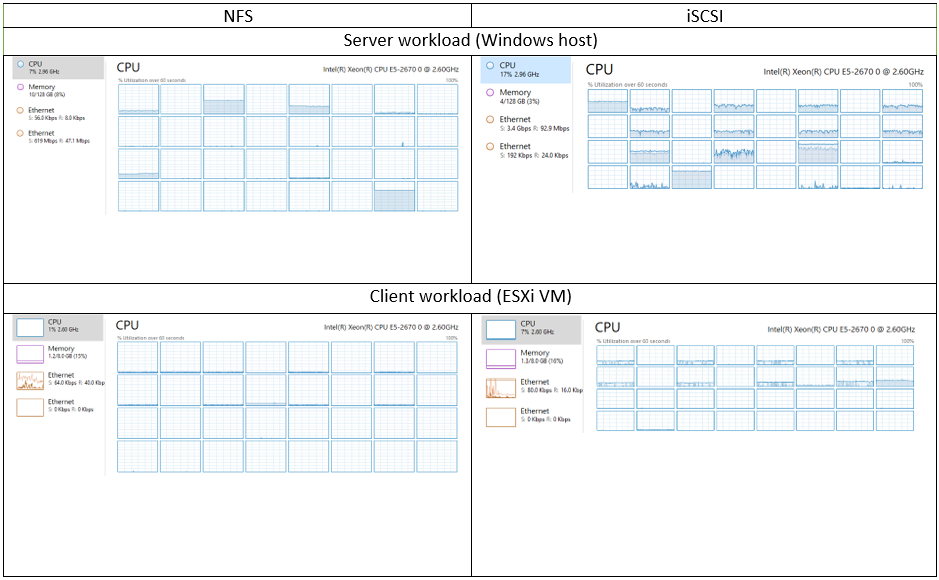
Image 1 – CPU workload: NFS vs iSCSI, DiskSpd (4k random read)
Now, let’s take a look at VM CPU workload during testing with 4k random read pattern, this time with FIO tool.
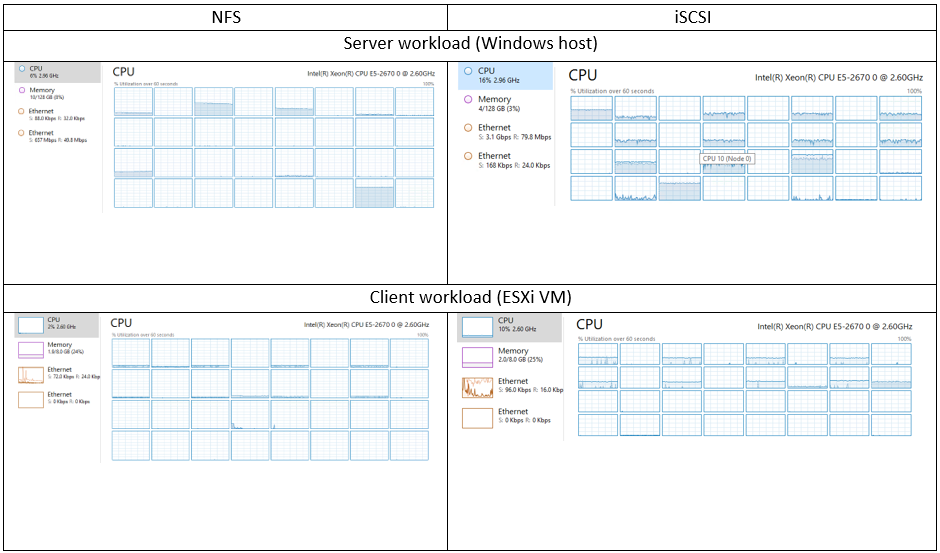
Image 2 – CPU workload: NFS vs iSCSI, FIO (4k random read)
Now, let’s take a look at VM CPU workload during testing with 4k random read pattern, this time with FIO tool.
As you can see, with identical settings, the server and VM workloads during NFS and iSCSI testing are quite different.
To give you the full picture of NFS performance and for additional comparison, I’ve decided to configure NFS on Linux OS. For this goal, I’ve chosen Ubuntu Server 17.10 distributive. Thus, I’ve measured the NFS server performance on Linux while VMware ESXi remained the client.
Comparing VM CPU workload during NFS server testing on different OS.
In the screenshots below, you can see the virtual machine CPU workload during NFS server testing on Windows and Linux with 4k random read pattern. The assessment was held using DiskSpd.
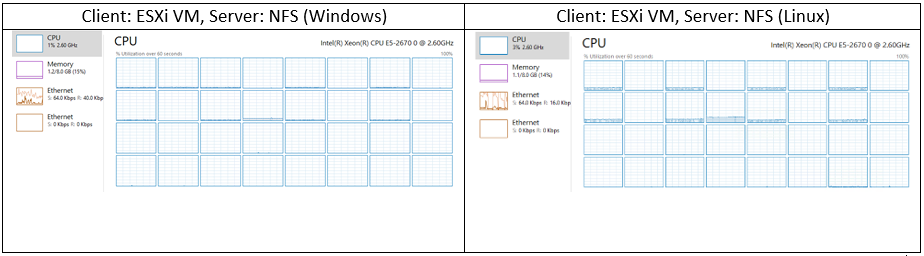
Image 3 – CPU workload: Windows vs Linux, DiskSpd (4k random read)
OK, let’s measure the VM CPU workload with FIO.
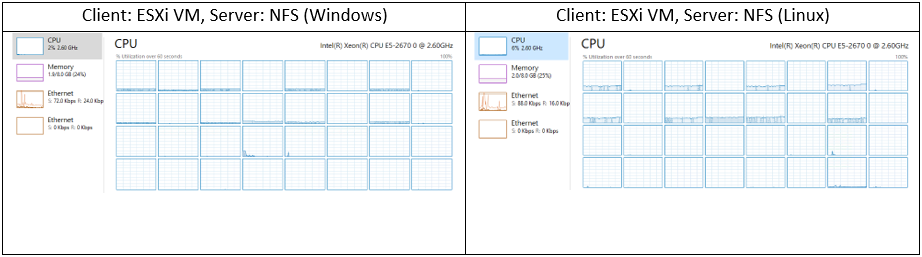
Image 4 – CPU workload: Windows vs Linux, FIO (4k random read)
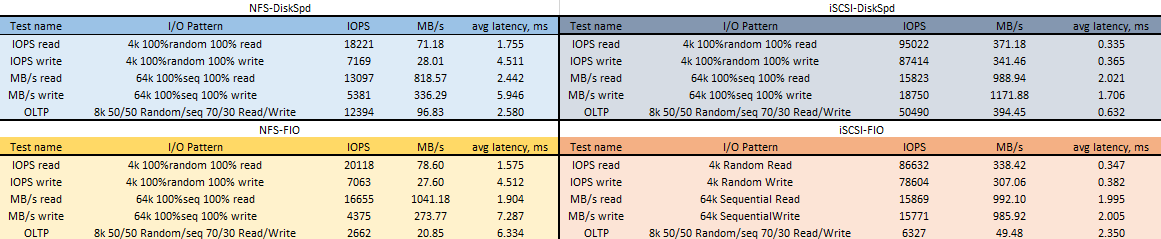
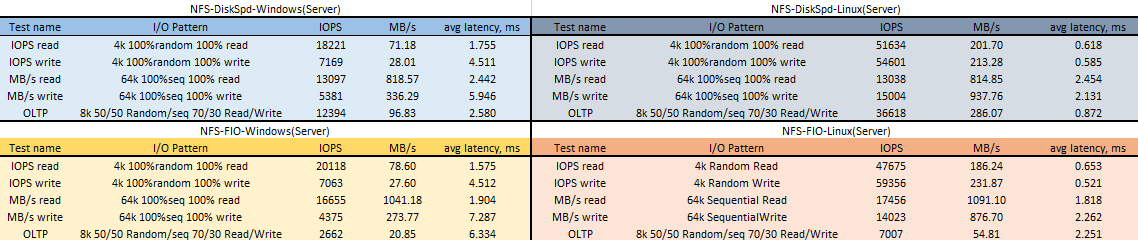
The results of testing VM’s disk subsystem performance
Testing NFS vs iSCSI performance with ESXi client connected to Windows Server 2016
Testing NFS Windows vs Linux performance:
- ESXi client is connected to Windows Server 2016
- ESXi client is connected to Linux Ubuntu Server 17.10
Conclusion
What can I say at the end of the day? Having compared FIO and DiskSpd utilities, we can see that the results are almost identical. Only during measurements with 8k 50/50 Random/seq 70/30 Read/Write pattern, the outcomes were different. Probably, the tools provided different workload on the disk subsystem.
OK, let’s take a look at what numbers tell us. I’ve conducted the further calculations using the test results I got with DiskSpd. When benchmarking NFS vs iSCSI, we can see that during testing under 4k 100%random 100%read patterns the iSCSI performance was 80.82% higher than that of NFS. Under 4k 100%random 100%write, iSCSI gives 91.80% better performance.
Under 64k 100%seq 100%read pattern, iSCSI performance is 17.23% higher while under 64k 100%seq 100%write pattern, iSCSI beats NFS with 71.30% better performance. To top that off, under 8k 50/50 Random/seq 70/30 Read/Write, iSCSI shown 75.45% higher performance than NFS.
Summary? It’s quite obvious, iSCSI protocol gives higher performance than NFS.
As to NFS server performance on different operating systems, we can see that NFS server performance on Linux is higher than that on Windows.
So, if your planning to build a virtualized infrastructure and can’t make up your mind on the network protocol…well, it’s obvious that iSCSI will give you much better performance and significantly lower latency. That may be a cornerstone for your production, but, it’s up to you to decide.
However, I’m not done with NFS yet. Here, I have tested an compared NFS server performance on Linux and Windows so in the next part, I’m gonna measure how well NFS protocol performs on Linux operating system. For this goal, I used Ubuntu Server 17.10 OS as a server and Ubuntu Server 17.10 VM as a client running on top of a VMware ESXi host. Here’re the results that I got: https://www.starwindsoftware.com/blog/hyper-v/whos-got-bigger-balls-testing-nfs-vs-iscsi-performance-part-4-testing-nfs-linux/.
Technically you gave your fio jobs an advantage over DISKSPD because direct=1 sync=1 is roughly the equivalent of -Sh (you didn’t have sync=1). However if your disks were SATA ones it’s highly unlikely this will change the result :-).
Another difference is that fio can’t really do DISKSPD’s -si where you share a single offset between all jobs for a given disk. This could have a big impact on sequential jobs as for reads I/O won’t be prefetched by other jobs and for both reads/writes the I/O will look closer to sequential as it goes down to disk whereas it might look a bit random otherwise.
Interesting result!
Not sure if i missed it, but you should compare Thick-Prov (Eager Zeroed) and formatted vmdks just to eliminate any performance loss due to allocating additional space for the vmdk.
Nice series of articles btw. 🙂
Thanks for the feedback, guys!
great experiment, I was trying to decide whether to use NFS or iSCSI, windows server or freenas. You article nailed it, it will choose iScsi with Linux as the shared storage for proxmox servers. Thanks a lot
You are always welcome!
I think that this test is beyond many professionals!
Was this test carried out with a normal frame size, or using Jumbos?
Hi, that’s actually a very good question, you know… I did this test a while ago and cannot remember any of the settings. As I built this test environment on StarWind and these guys recommend using Jumbos, I may have also used Jumbos here. Sorry for being unable to answer your question for sure.
Thanks!