INTRODUCTION
This technical paper provides information on how to deploy StarWind Manager and its components.
StarWind Manager is initially designed to provide administrators with a single interface for deploying, managing and monitoring Microsoft Storage Spaces Direct and Ceph-based clusters. Also, StarWind Manager can be used to collect the in-depth performance and health metrics from the local infrastructure, simplifying the day-to-day routine of system administrators. Webbased dashboard displays real-time compute resources utilization and storage metrics: CPU, RAM, network throughput, storage IOPS and latency.
This guide is intended for experienced StarWind users, Windows system administrators and IT professionals who would like to configure StarWind Manager solution. It provides a step-by-step guidance on how to deploy the necessary software components and start working with StarWind
Manager.
A full set of up-to-date technical documentation can always be found here.
For any technical inquiries, please visit our online community, Frequently Asked Questions page, or use the support form to contact our technical support department.
Pre-Configuration
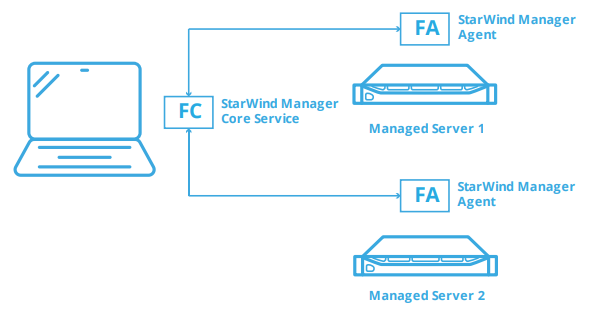
StarWind Manager Core Service – the central element which coordinates, analyzes and provides a set of interfaces for interaction with it.
StarWind Manager Agent – installed on the server that needs to be managed.
In this guidance, we describe the configuration process using a simplified etup as an example.
We will deploy StarWind Manager Agents on “Managed Server 1” and “Managed Server 2”. StarWind Manager Core Service will be deployed on the Client PC.
The main components (StarWind Manager Agent(s) and StarWind Manager Core Service) can be also deployed in a different manner, according to your specific infrastructure requirements.
Installing StarWind Manager Agents
1. Launch the downloaded setup file on the server where you wish to install StarWind Manager Agent. In our example, we use “Managed Server 1” and “Managed Server 2” for this purpose. The Setup wizard will appear:
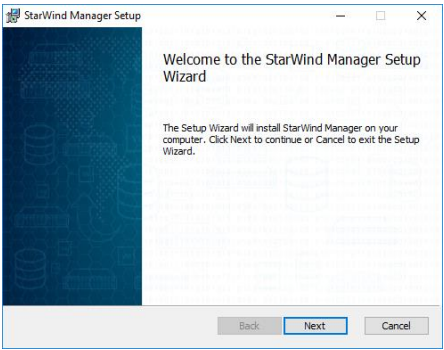
Click NEXT to continue.
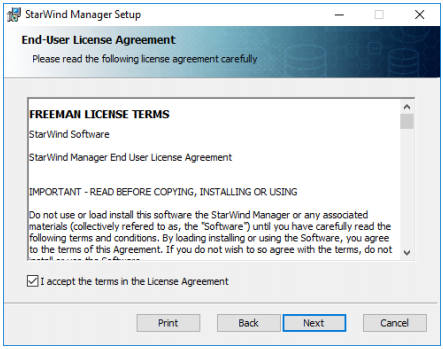
2. Read and accept the License Agreement.

Click NEXT to continue.
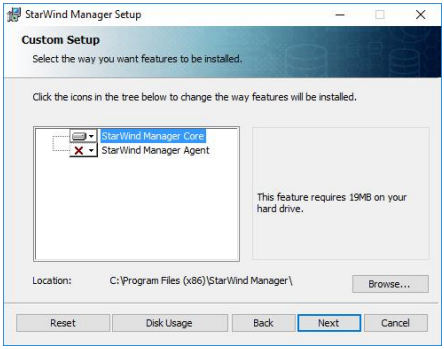
3. Choose to install only StarWind Manager Agent. Do not install StarWind Manager Core.
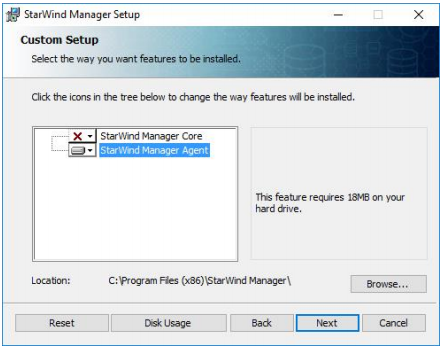
Click NEXT to continue.
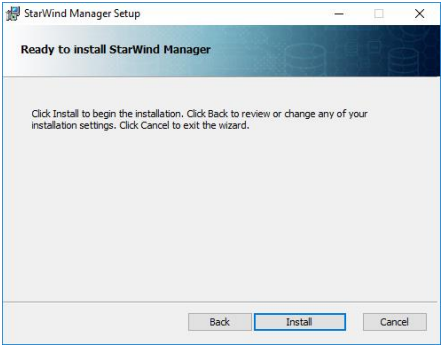
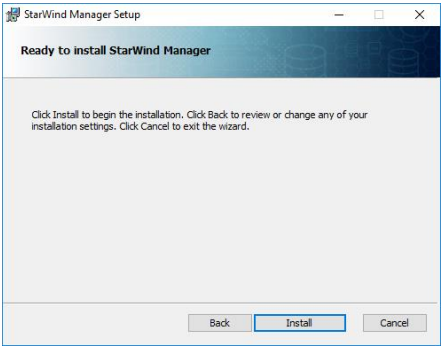
4. Click Install to begin the installation.
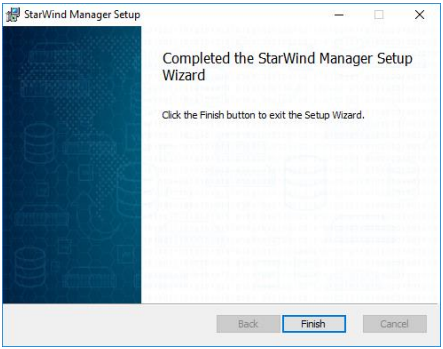
5. After the installation process is finished, press Finish button to exit the wizard.
6. Repeat the above steps on “Managed Server 2” to complete the installation of StarWind Manager Agents.
Installing StarWind Manager Core Service
7. Launch the downloaded setup file on the server where you wish to install StarWind Manager Core Service. In our example, we use Client PC for this purpose. The Setup wizard will appear:

Click NEXT to continue.
8. Read and accept the License Agreement.
Click NEXT to continue.
9. Choose to install only StarWind Manager Core Service and specify the installation path. Do not install StarWind Manager Agent.
Click NEXT to continue.
10. Click Install to begin the installation.
11. After the installation process is finished, press Finish button to exit the wizard.
StarWind Manager Core Service is now installed.
Adding servers to StarWind Manager Web Console
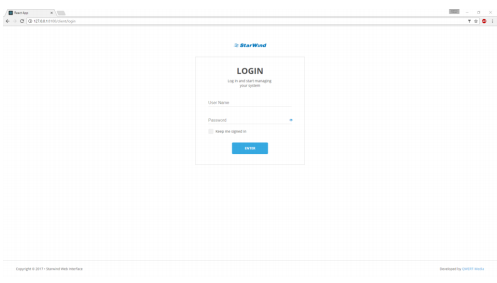
12. Open web browser on the Client PC where StarWind Manager Core Service was installed.
Navigate to http://127.0.0.1:8100/client
StarWind Manager Web Console interface should appear:
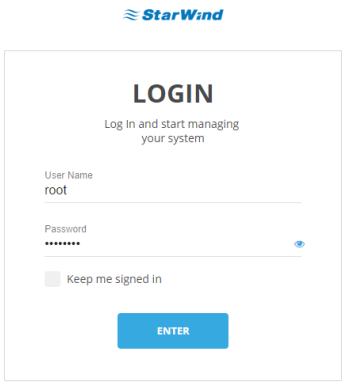
13. Specify the below credentials and press “Enter”
Login: root
Password: starwind
14. The main console interface will appear after successful login:
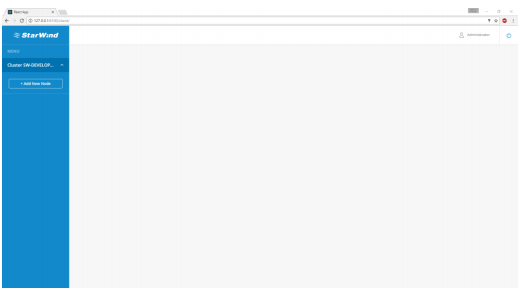
15. To monitor the infrastructure, each server that has StarWind Manager Agent installed should be added to the StarWind Manager Cluster. Press “Add New Node” to add the new server to the list.
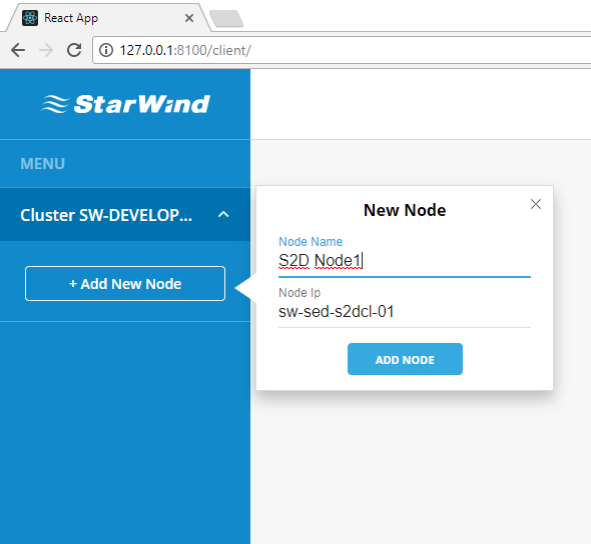
Enter the desired server name, specify server IP address and press “Add Node”.
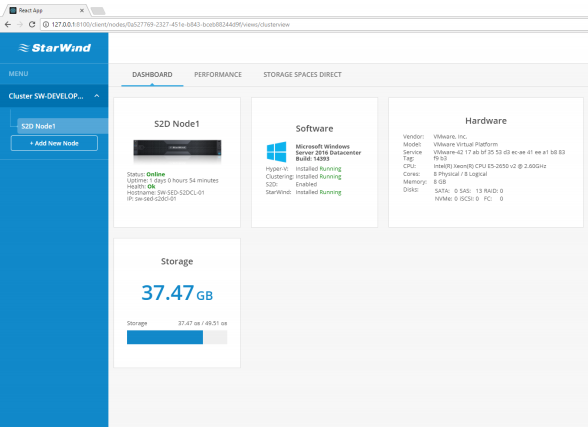
16. After “Server 1” is successfully added to the list, the main Dashboard will appear.
Main Dashboard displays general server information:
• Server status
• Software information
• Hardware information
• Total storage capacity
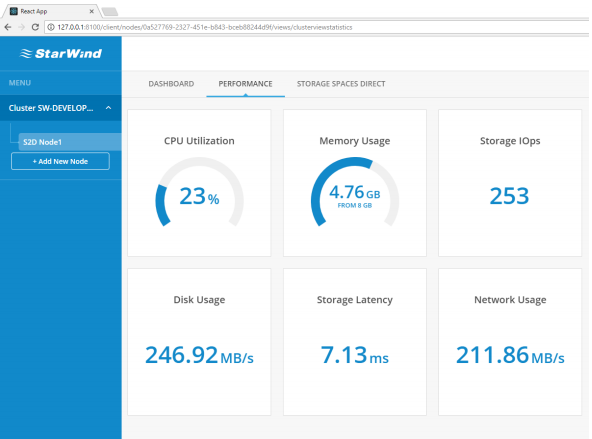
17. Navigate to “Performance” overview.
Performance dashboard displays current workload metrics:
• CPU utilization
• RAM usage
• Total storage IOPS
• Total disk throughput
• Total storage latency
• Total network utilization
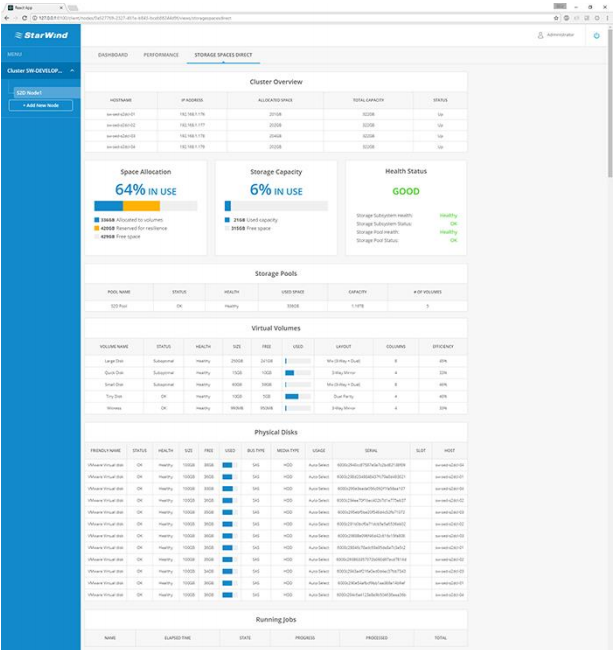
18. Navigate to “Storage Spaces Direct” overview.
Storage Spaces Direct dashboard consists of several widgets and tables displaying the most important S2D Cluster information and parameters:
• Cluster Overview table displays the essential information such as names and IP addresses of participating servers, their total capacity, allocated space and status.
• Space Allocation widget shows how much storage capacity is allocated to S2D volumes and reserved for resilience.
• Storage Capacity widget displays the actual amount of used and free space.
• Health Status widget displays the S2D cluster overall health status along with additional statuses of the crucial S2D components.
• Storage Pools table shows the general information of S2D pool.
• Virtual Volumes table displays the list of S2D volumes, their parameters, statuses and storage utilization statistics.
• Physical Disks table provides the vital information about physical disk drives used in S2D pool.
19. Now you can add the “Server 2” (along with other servers that should be monitored) to the list in the same way as described in previous steps and use StarWind Manager to gather necessary information, monitor the performance or observe your Storage Spaces Direct infrastructure.
CONCLUSION
StarWind Manager provides a straightforward infrastructure monitoring through the combination of configurable dashboards and plug-ins. All the necessary information and metrics are displayed in a more convenient and practical way. StarWind Manager allows monitoring the status, health and capacity utilization of Storage Spaces Direct infrastructure and provides the ability to monitor the performance and resource usage of standalone windows servers. Administrators no longer need to switch between the PowerShell console, Server Manager, and Failover Cluster Manager to collect the required information or check the cluster health.