
Introduction
As time goes on, fewer and fewer people tend to rely on cumbersome SANs. It doesn’t mean that they have become obsolete; it’s just that many small and medium-sized enterprises (SMEs) simply don’t require all the broad specter of services and resources that a storage area network system can offer. That makes perfect sense: if you can farewell with a less complicated and resource-hungry configuration – why pay more?
Virtual SANs have become the newfound Holy Grail of small infrastructures. And why not? They offer software-defined storage solutions that support HCI systems and leave external shared storage out of the picture. An introduction of virtual SAN solutions to the market has changed a lot, opening the way for simple storage configurations that can provide maximum possible performance with minimum possible resources required, respectively.
Since the market has emerged, it didn’t take long to recognize the leaders, which are StarWind Virtual SAN (VSAN) and VMware virtual SAN (vSAN). All else being equal, neither is considered better or worse. However, each IT environment is, in a way, unique. I don’t need to tell you about the multitude of configurations out there. So, with the diversity of HCI systems and hardware requirements in mind, this begets a question: are these solutions really giving away an equal performance, all things considered?

Time to Talk Business
Naturally, whenever such a question arises, talking won’t do much: the only way to come up with an answer is by testing, through and through. So, today’s goal is to compare StarWind VSAN and VMware vSAN performance with the same 2-node configuration.
First things first, let’s build a test environment (performing testing procedures in your work infrastructure is never a good idea) and check requirements:
| node-{01..02} | Supermicro X10DRH |
|---|---|
CPU |
2x Intel(R) Xeon(R) CPU E5-2630 v4 @ 2.20GHz |
Sockets |
2 |
Cores/Threads |
20/40 |
RAM |
64Gb |
NIC |
Mellanox ConnectX-5 MCX456A-ECAT (100 GbE\s) |
Storage |
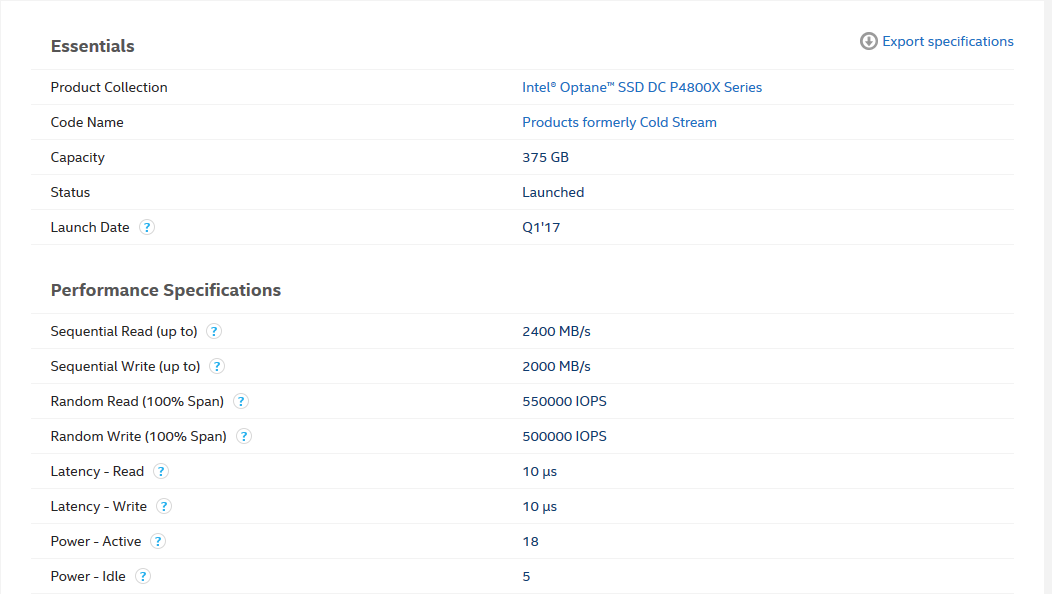
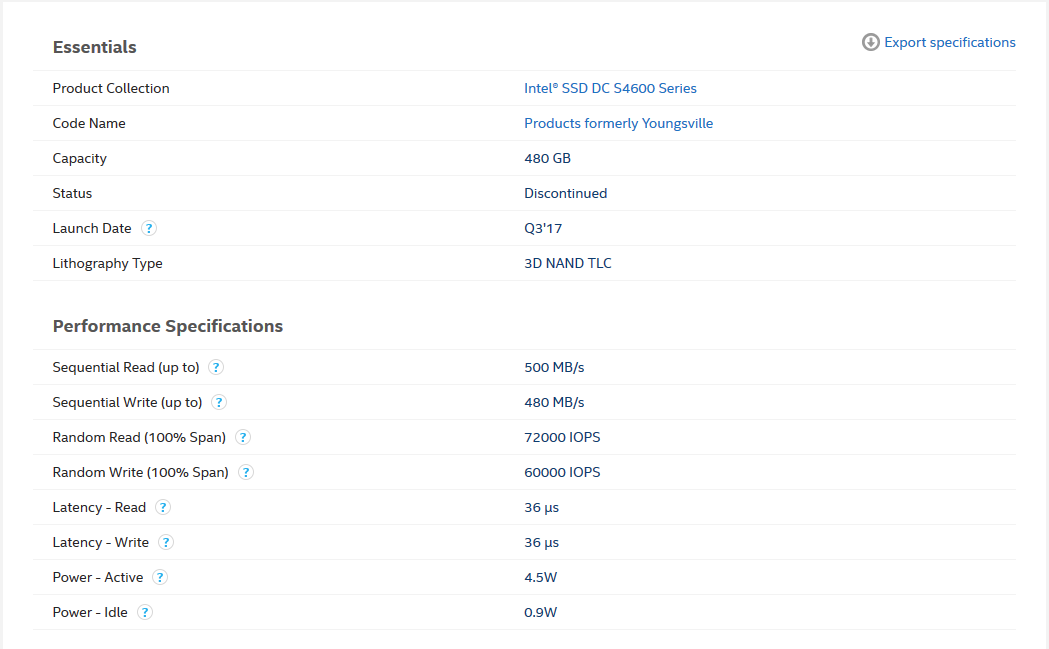
5 (SSD) – Intel® SSD DC S4600 Series 480GB 1 (NVMe) – Intel® Optane™ SSD DC P4800X Series 375GB |
| node-witness | Supermicro X10DRH |
|---|---|
CPU |
2x Intel(R) Xeon(R) CPU E5-2630 v4 @ 2.20GHz |
Sockets |
2 |
Cores/Threads |
20/40 |
RAM |
64Gb |
NIC |
Mellanox ConnectX-5 MCX456A-ECAT (100 GbE\s) |
Storage |
1 (SSD) – Intel® SSD DC S4600 Series 480GB 1 (NVMe) – Intel® Optane™ SSD DC P4800X Series 375GB |
Software:
| VMware ESXi | 7.0.0, 16324942 |
|---|---|
| HCIBench | 2.4.0 |
| StarWind VSA | 13792 |
VMware vSAN:
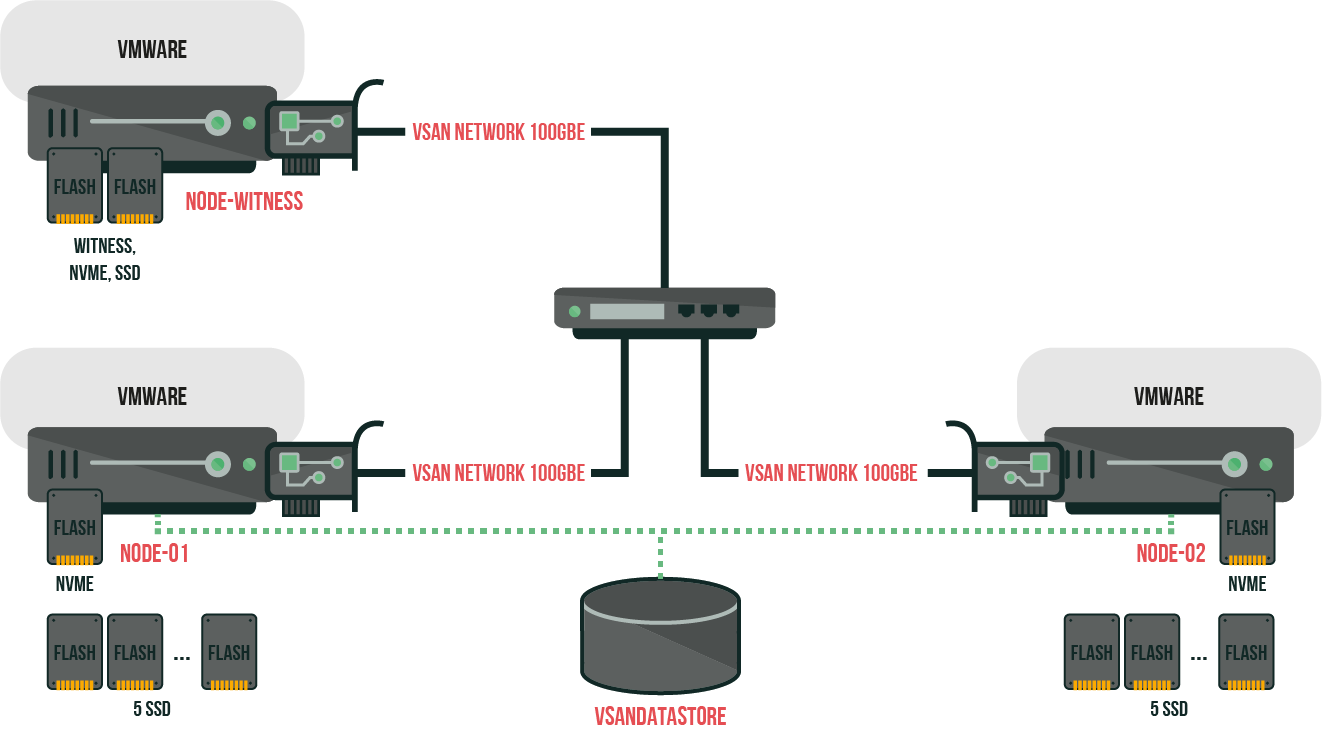
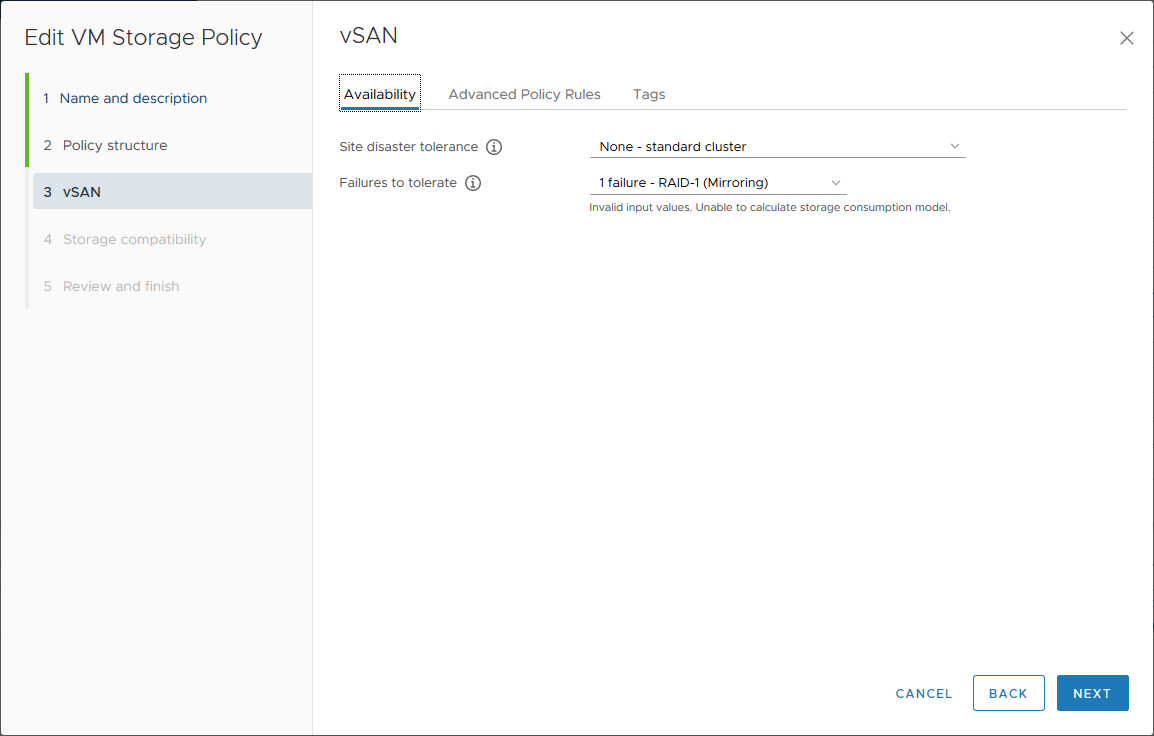
Well, as you know, VMWare vSAN supports a configuration “2 nodes + witness node + 2 caching disks + capacity witness”.
In order to create a vSAN datastore on each node, you’ll need a caching disk on each node, respectively.
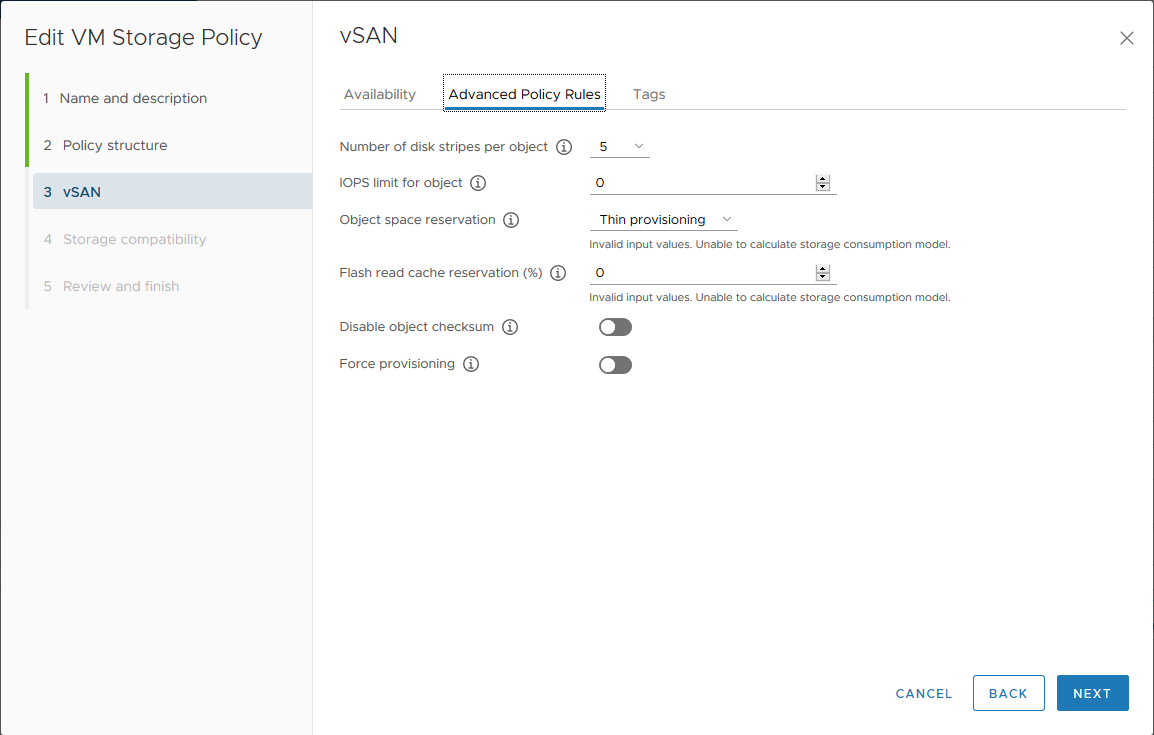
With vSAN Storage Policy, this isn’t hard; you can even set a number of disk stripes per object. VMWare vSAN supports the optimization of the data distribution to the disks as well.
That’s why we’ll also need to test configurations with the following parameters: “Number of disk stripes per object = 1/=5” and “Number of disk stripes per object = 1 + rebalance.” Otherwise, there’s no telling what an optimal configuration is.
StarWind VSAN:
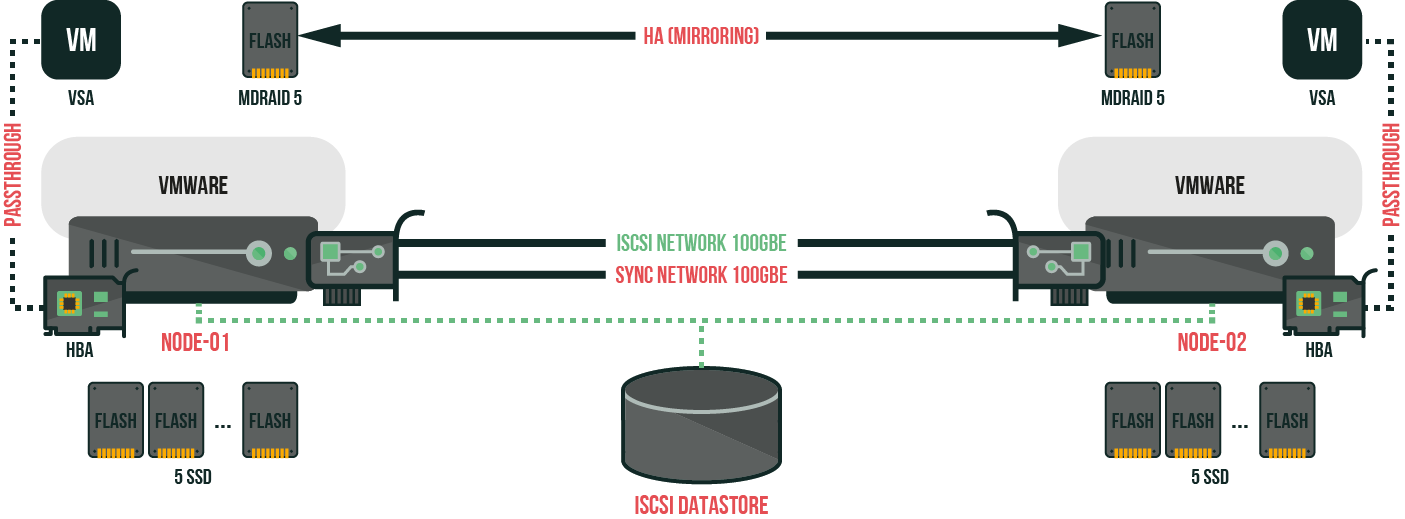
Testing methods:
I plan on performing testing with the following configuration: “HCIBench + fio”.
HCIBench will create test VMs with zeroed 100GB disk and launch fio with the following parameters:
Random Read 4k:
|
1 |
fio --name=job-name --rw=randread --numjobs=4 --iodepth=4 --blocksize=4K --direct=1 --ioengine=libaio --time_based=1 --group_reporting --lat_percentiles=1 --continue_on_error=all --filename=/dev/sda |
Random Write 4k:
|
1 |
fio --name=job-name --rw=randwrite --numjobs=4 --iodepth=4 --blocksize=4K --direct=1 --ioengine=libaio --time_based=1 --group_reporting --lat_percentiles=1 --continue_on_error=all --filename=/dev/sda |
Random Read/Write (70%/30%) 4k:
|
1 |
fio --name=job-name --randrw --rwmixread=70 --numjobs=4 --iodepth=4 --blocksize=4K --direct=1 --ioengine=libaio --time_based=1 --group_reporting --lat_percentiles=1 --continue_on_error=all --filename=/dev/sda |
Random Read 64k:
|
1 |
fio --name=job-name --rw=randread --numjobs=4 --iodepth=2 --blocksize=64K --direct=1 --ioengine=libaio --time_based=1 --group_reporting --lat_percentiles=1 --continue_on_error=all --filename=/dev/sda |
Random Write 64k:
|
1 |
fio --name=job-name --rw=randwrite --numjobs=4 --iodepth=2 --blocksize=64K --direct=1 --ioengine=libaio --time_based=1 --group_reporting --lat_percentiles=1 --continue_on_error=all --filename=/dev/sda |
The amount of VMs will be increased by 2 each time to establish the highest performance possible.
In the case with VMware vSAN, HCIBench will keep on clearing the cache after each testing (Clear Read/Write Cache Before Each Testing is the option designed for vSAN users to flush the cache tier before each test case).
By the way, testing time will differ because VMware vSAN actually uses caching; so, it’ll take some time until it’s clean and ready to go.
Results were as follows:
Test time:
VMware vSAN – 3600 seconds;
StarWind VSAN – 300 seconds.
NVMe, SSD, and RAID performance testing for StarWind VSAN;
As declared by the manufacturer:
As received by fio testing:
Intel® Optane™ SSD DC P4800X Series 375GB |
|||||
|---|---|---|---|---|---|
pattern |
jobs |
iodepth |
IOPS |
MB/s |
latency (ms) |
| 4k random read | 6 | 4 | 583000 | 2276 | 0,04 |
| 4k random write | 6 | 4 | 560000 | 2189 | 0,04 |
| 64k random read | 2 | 2 | 40400 | 2522 | 0,10 |
| 64k random write | 2 | 2 | 35100 | 2194 | 0,10 |
| Intel® SSD DC S4600 Series 480GB | |||||
|---|---|---|---|---|---|
pattern |
jobs |
iodepth |
IOPS |
MB/s |
latency (ms) |
| 4k random read | 4 | 8 | 73200 | 286 | 0,33 |
| 4k random write | 4 | 4 | 64700 | 253 | 0,25 |
| 64k random read | 4 | 2 | 4031 | 252 | 1,90 |
| 64k random write | 2 | 2 | 6858 | 429 | 0,59 |
|
1 2 3 4 5 |
mdraid --level=5 --chunk=4K --raid-devices=5 echo 512 > /sys/block/md0/md/stripe_cache_size echo 2 > /sys/block/md0/md/group_thread_cnt |
pattern |
jobs |
iodepth |
IOPS |
MB/s |
latency (ms) |
|---|---|---|---|---|---|
| 4k random read | 8 | 16 | 346000 | 1353 | 0,35 |
| 4k random write | 8 | 8 | 57800 | 226 | 1,10 |
| 64k random read | 4 | 8 | 27700 | 1727 | 1,15 |
| 64k random write | 4 | 4 | 22400 | 1400 | 0,70 |
VMware vSAN 8VM with “Number of disk stripes per object = 1, 1 + rebalance, and 5” (the amount of disks in each node) parameters performance testing results:
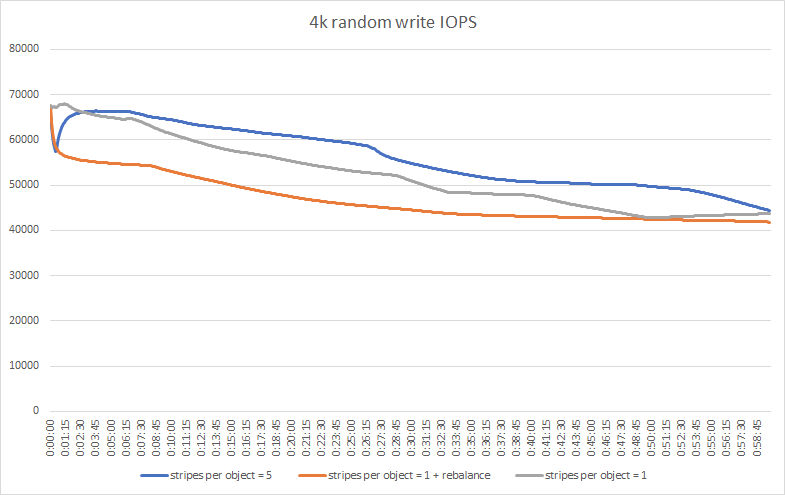
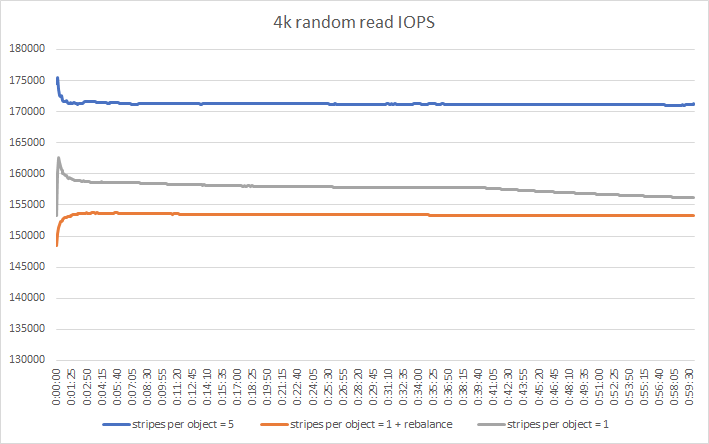
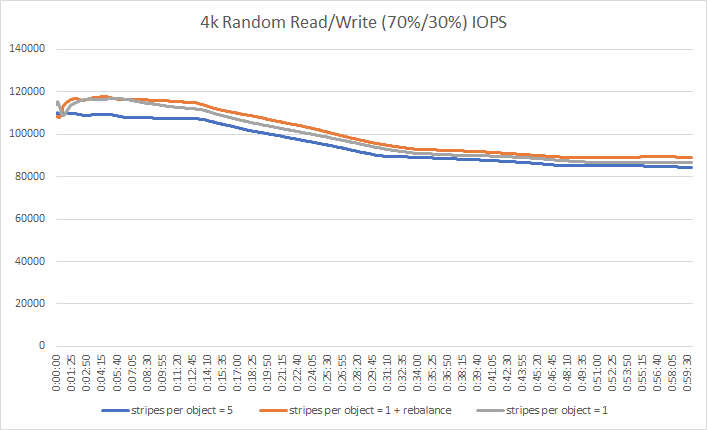
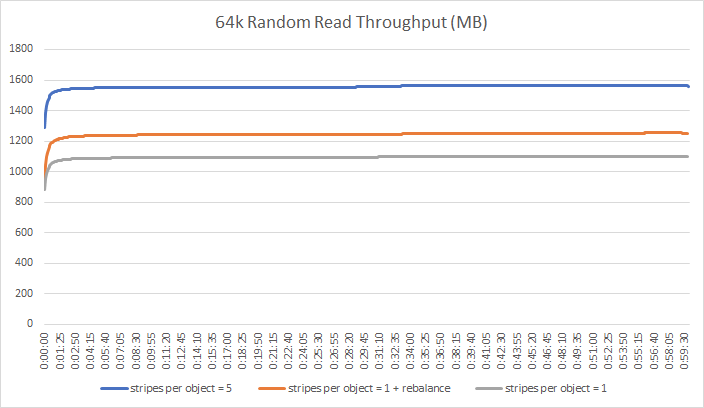
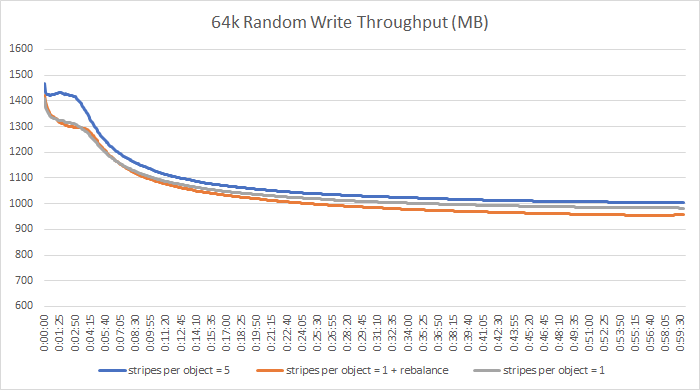
Well, as you can see for yourself, our test results imply that “Number of disk stripes per object = 5” is the optimal parameter for this configuration, performance-wise.
Who Is Leading the Race?
All the preparations and tests are done, for now, so it’s time to see the results in our comparison VMware vSAN vs. StarWind VSAN.
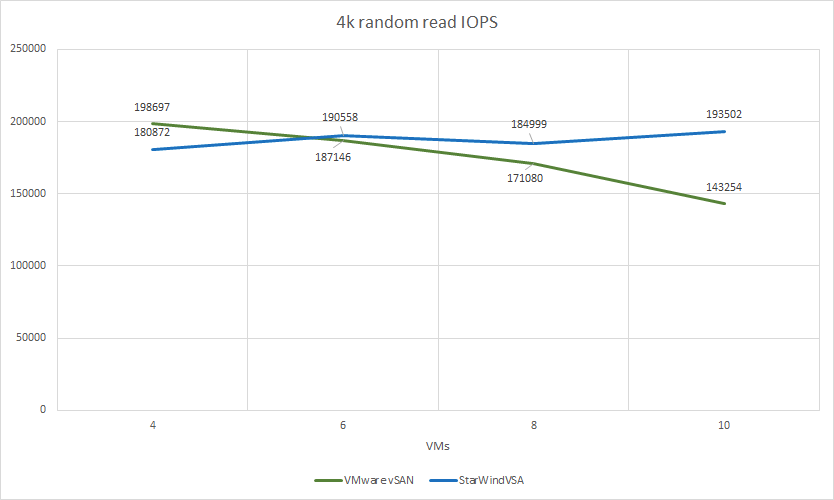
Just keep in mind that VMware vSAN uses caching, meaning we need to look at the last results, not the middle ones:
| VMware vSAN | StarWind VSAN | Comparison | ||||||||||||
|---|---|---|---|---|---|---|---|---|---|---|---|---|---|---|
| VMs count | pattern | jobs | iodepth | IOPS | MB/s | latency (ms) | jobs | iodepth | IOPS | MB/s | latency (ms) | IOPS | MB/s | latency (ms) |
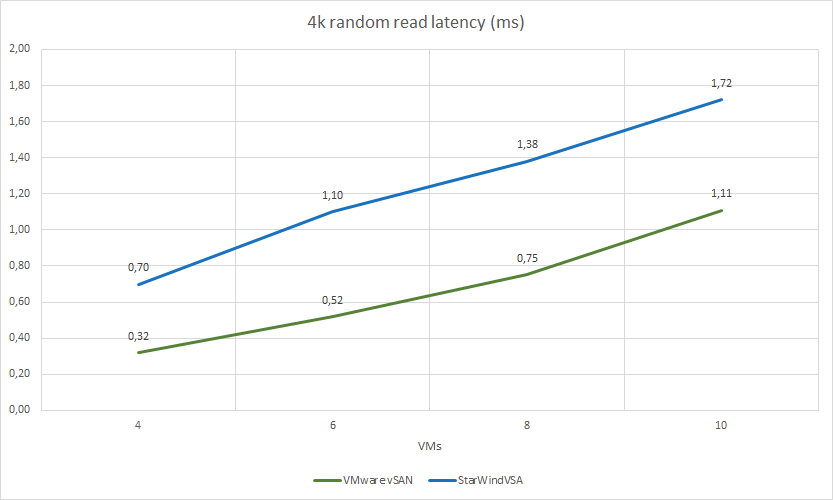
| 4 | 4k random read | 4 | 4 | 198697 | 776 | 0,32 | 4 | 8 | 180872 | 706 | 0,70 | 91,03% | 90,98% | 218,75% |
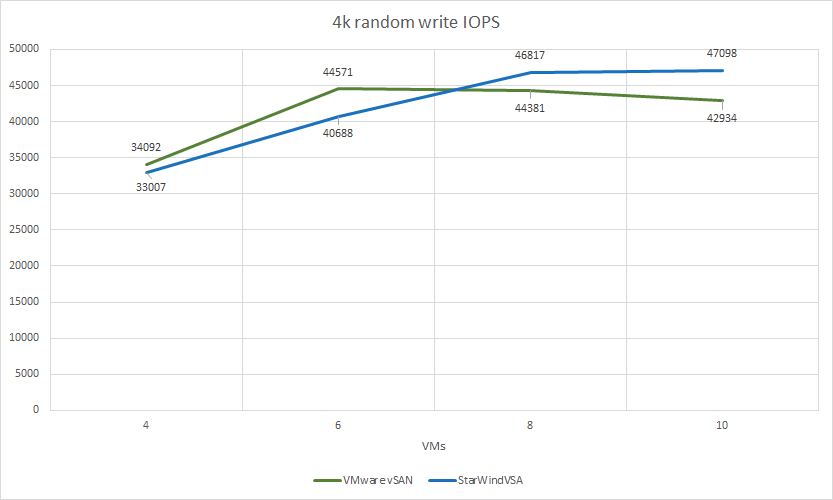
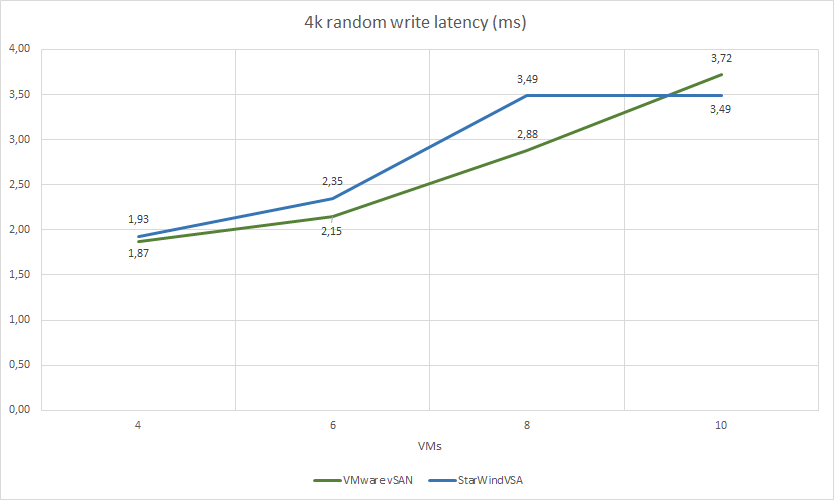
| 4k random write | 4 | 4 | 34092 | 133 | 1,87 | 4 | 4 | 33007 | 128 | 1,93 | 96,82% | 96,24% | 103,21% | |
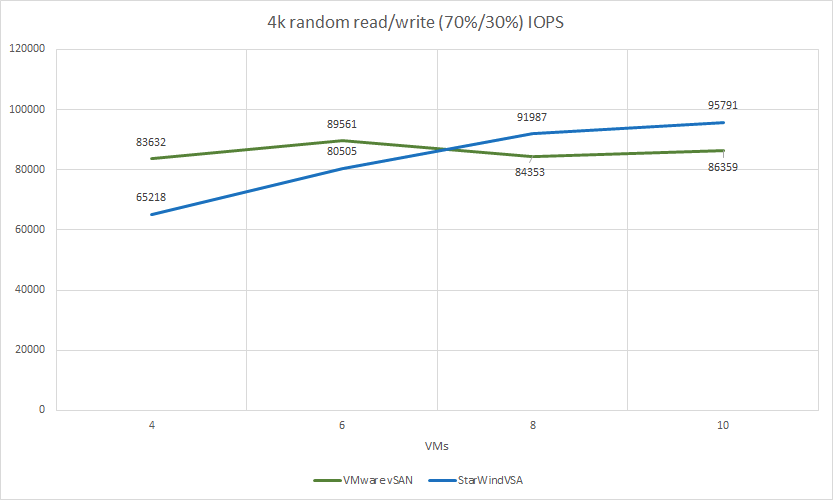
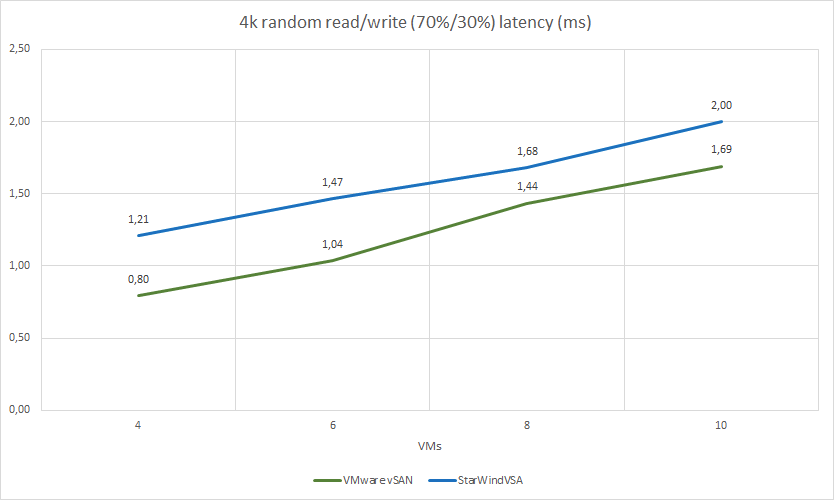
| 4k random read/write (70%/30%) | 4 | 4 | 83632 | 326 | 0,80 | 4 | 4 | 65218 | 254 | 1,21 | 77,98% | 77,91% | 152,20% | |
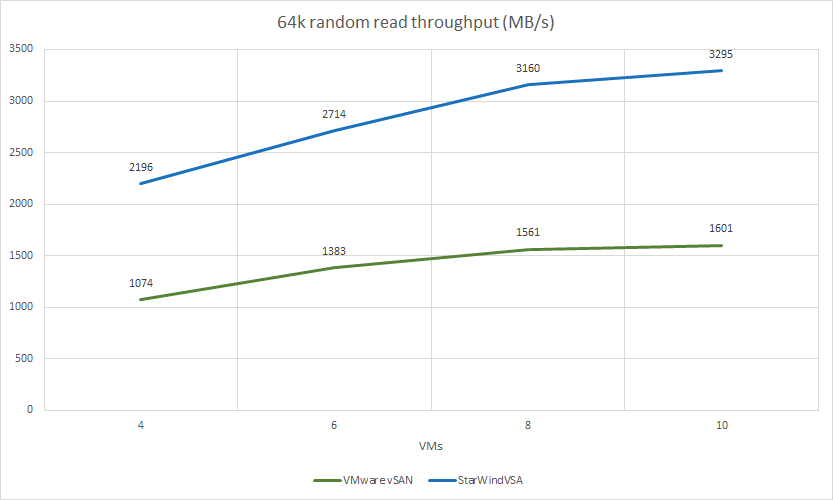
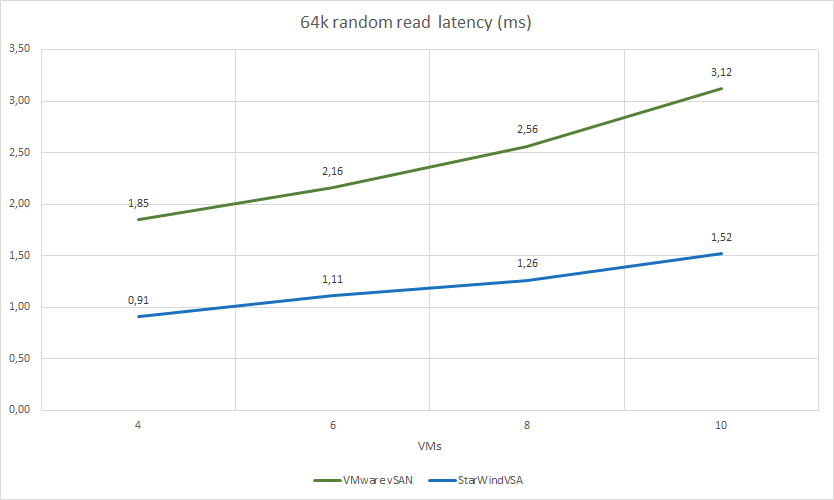
| 64k random read | 4 | 2 | 17192 | 1074 | 1,85 | 4 | 2 | 35142 | 2196 | 0,91 | 204,41% | 204,47% | 49,19% | |
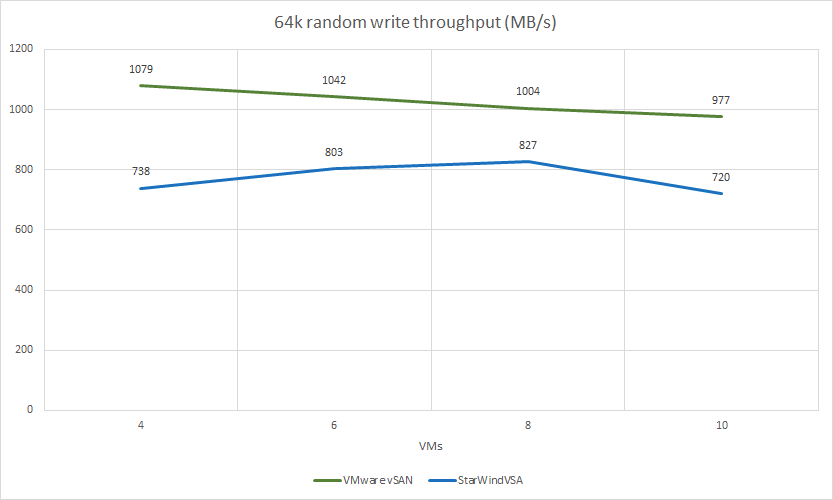
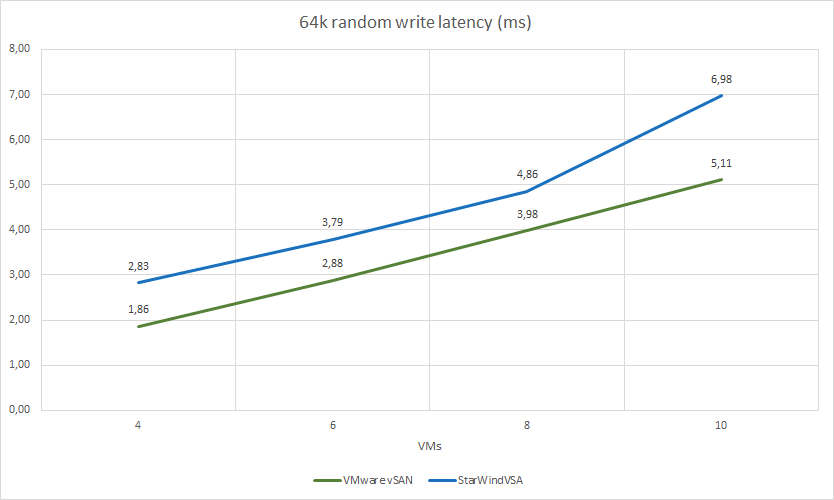
| 64k random write | 4 | 2 | 17273 | 1079 | 1,86 | 4 | 2 | 11814 | 738 | 2,83 | 68,40% | 68,40% | 152,15% | |
| VMware vSAN | StarWind VSAN | Comparison | ||||||||||||
|---|---|---|---|---|---|---|---|---|---|---|---|---|---|---|
| VMs count | pattern | jobs | iodepth | IOPS | MB/s | latency (ms) | jobs | iodepth | IOPS | MB/s | latency (ms) | IOPS | MB/s | latency (ms) |
| 6 | 4k random read | 4 | 4 | 187146 | 731 | 0,52 | 4 | 8 | 190558 | 744 | 1,10 | 101,82% | 101,78% | 211,54% |
| 4k random write | 4 | 4 | 44571 | 174 | 2,15 | 4 | 4 | 40688 | 158 | 2,35 | 91,29% | 90,80% | 109,30% | |
| 4k random read/write (70%/30%) | 4 | 4 | 89561 | 349 | 1,04 | 4 | 4 | 80505 | 314 | 1,47 | 89,89% | 89,97% | 141,55% | |
| 64k random read | 4 | 2 | 22143 | 1383 | 2,16 | 4 | 2 | 43438 | 2714 | 1,11 | 196,17% | 196,24% | 51,39% | |
| 64k random write | 4 | 2 | 16678 | 1042 | 2,88 | 4 | 2 | 12862 | 803 | 3,79 | 77,12% | 77,06% | 131,60% | |
<thIOPS<thMB/slatency (ms)
| VMware vSAN | StarWind VSAN | Comparison | ||||||||||||
|---|---|---|---|---|---|---|---|---|---|---|---|---|---|---|
| VMs count | pattern | jobs | iodepth | IOPS | MB/s | latency (ms) | jobs | iodepth | IOPS | MB/s | latency (ms) | |||
| 8 | 4k random read | 4 | 4 | 171080 | 668 | 0,75 | 4 | 8 | 184999 | 722 | 1,38 | 108,14% | 108,08% | 184,00% |
| 4k random write | 4 | 4 | 44381 | 173 | 2,88 | 4 | 4 | 46817 | 182 | 3,49 | 105,49% | 105,20% | 121,18% | |
| 4k random read/write (70%/30%) | 4 | 4 | 84353 | 329 | 1,44 | 4 | 4 | 91987 | 359 | 1,68 | 109,05% | 109,12% | 117,07% | |
| 64k random read | 4 | 2 | 24992 | 1561 | 2,56 | 4 | 2 | 50569 | 3160 | 1,26 | 202,34% | 202,43% | 49,22% | |
| 64k random write | 4 | 2 | 16074 | 1004 | 3,98 | 4 | 2 | 13233 | 827 | 4,86 | 82,32% | 82,37% | 122,11% | |
| VMware vSAN | StarWind VSAN | Comparison | ||||||||||||
|---|---|---|---|---|---|---|---|---|---|---|---|---|---|---|
| VMs count | pattern | jobs | iodepth | IOPS | MB/s | latency (ms) | jobs | iodepth | IOPS | MB/s | latency (ms) | IOPS | MB/s | latency (ms) |
| 10 | 4k random read | 4 | 4 | 143254 | 559 | 1,11 | 4 | 8 | 193502 | 755 | 1,72 | 135,08% | 135,06% | 154,95% |
| 4k random write | 4 | 4 | 42934 | 167 | 3,72 | 4 | 4 | 47098 | 183 | 3,49 | 109,70% | 109,58% | 93,82% | |
| 4k random read/write (70%/30%) | 4 | 4 | 86359 | 337 | 1,69 | 4 | 4 | 95791 | 374 | 2,00 | 110,92% | 110,98% | 118,34% | |
| 64k random read | 4 | 2 | 25621 | 1601 | 3,12 | 4 | 2 | 52729 | 3295 | 1,52 | 205,80% | 205,81% | 48,72% | |
| 64k random write | 4 | 2 | 15637 | 977 | 5,11 | 4 | 2 | 11536 | 720 | 6,98 | 73,78% | 73,69% | 136,59% | |
To Sum Up
You have seen that even without caching, StarWind VSAN performance can match or even surpass the performance of VMware vSAN. Does it mean that VMware vSAN is worse? Or that StarWind VSAN is better? Not really, but it does give some food for thought.
VMware vSAN is an undisputable champion when it comes to native hardware: you can manage and configure it any way you want with only a few clicks in VMware vCenter. Then again, if you’re a little tight on money and even such detail as a spare node slowly starts to look a little bit too luxurious … Well, StarWind VSAN, as a solution fully compatible with any hypervisor, can help you actually have your cake and eat it too.