
Very often, VMware vSphere administrators have to find the reasons of performance issues by analyzing the historical data of various metrics on the VMware vCenter Server. However, sometimes the default set of metrics is not enough if you view performance data for the previous night or the end of the past week – in this case, you need to change the level of collected metrics and, possibly, the frequency of their collection and retention.
In the VMware vCenter Server settings, you can set the data collection levels, different collection intervals and the time period that the data will be stored on the Server. In addition, you can set an approximate size of the virtual infrastructure in the host servers and virtual machines, which will allow to roughly estimate the size of the vCenter database. Let’s take a closer look at these settings.
We’ll go to the vSphere Web Client console, select vCenter and click the “Configure” tab. In the Settings section, select the “General” item and click “Edit“. Here, in the “Statistics” section, we will see the following picture:
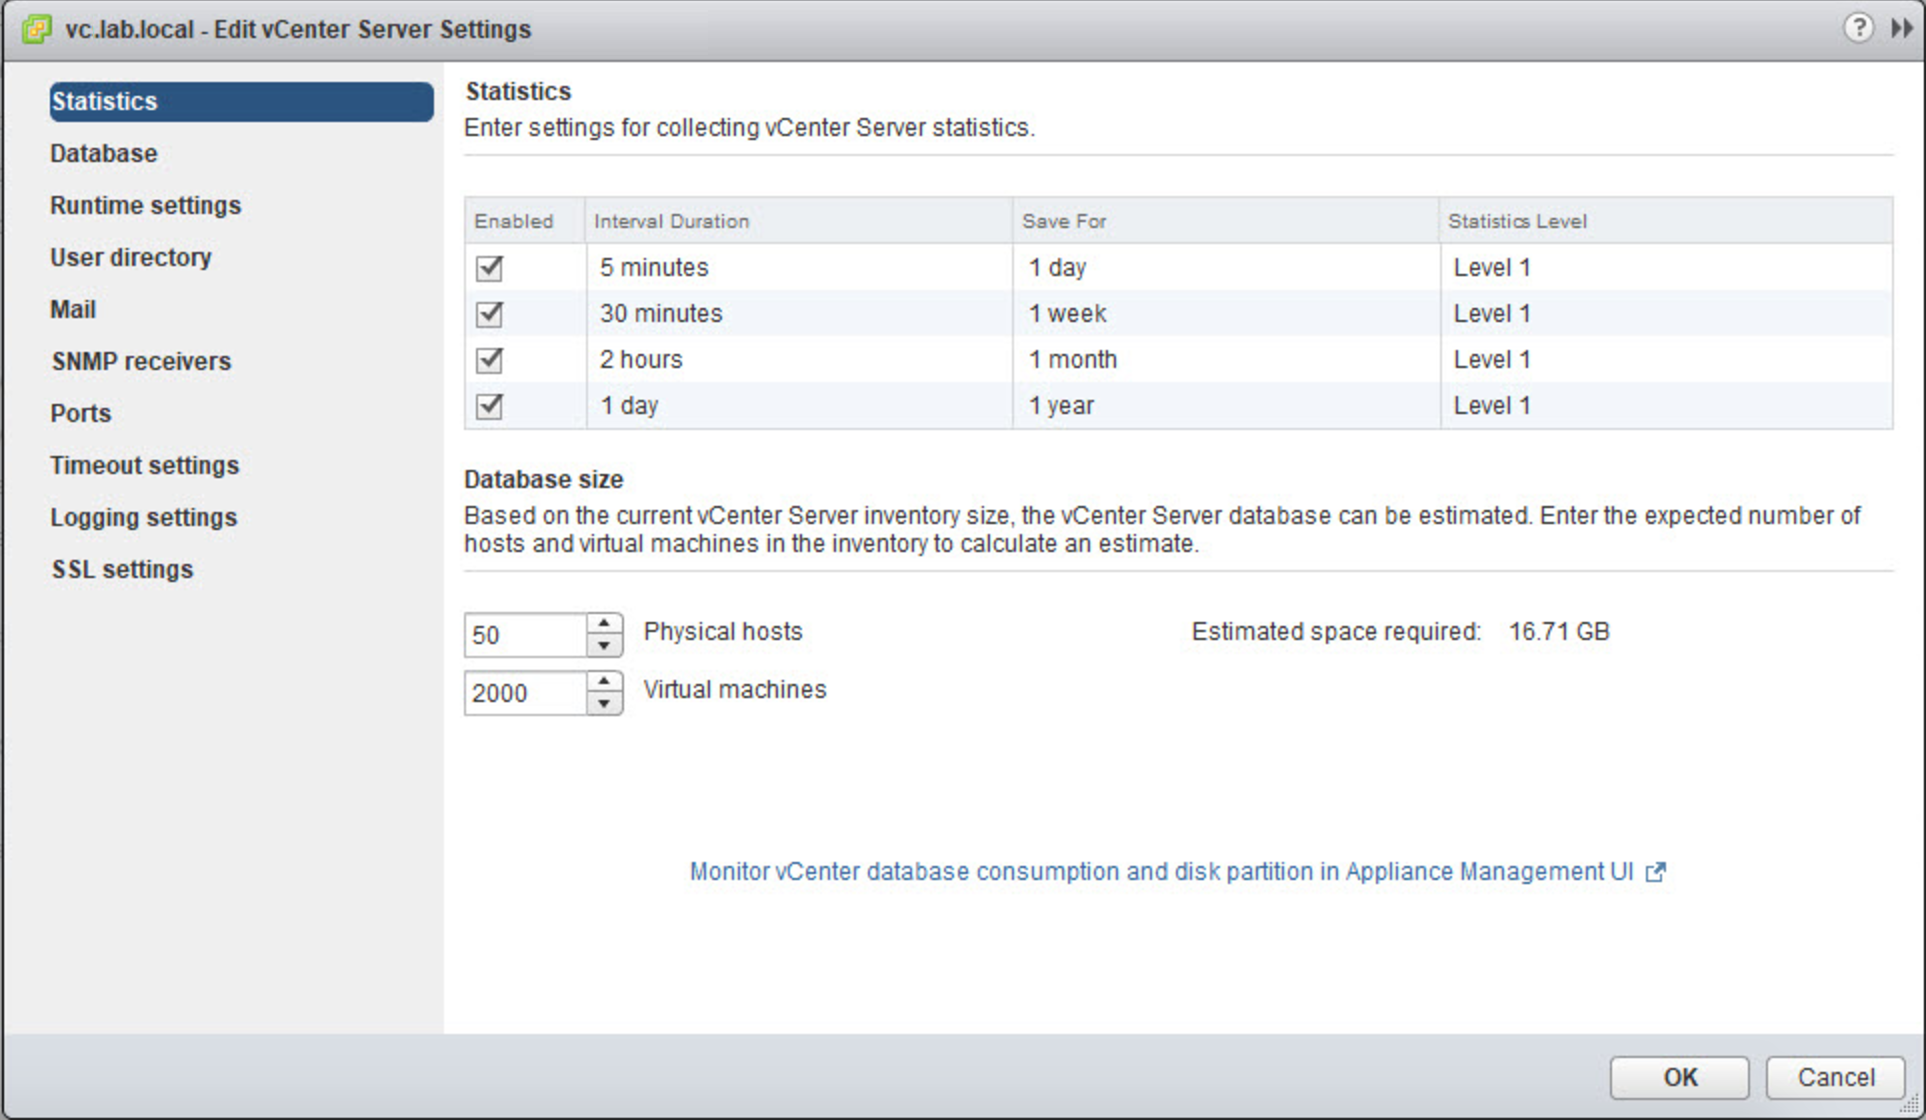
The picture shows 4 statistics levels, which differ, first of all, by the data collection interval. Each of the three columns – Interval Duration, Save For and Statistics Level – can be changed to the appropriate level.
The higher the Statistics Level, the more data is collected. In total, there are four levels; the most detailed statistics are collected at level 4 (it should be used only for deep debugging in real time, as the vCenter database will be filled very quickly).
You should keep in mind that statistics level 1 and 2 can be used when the virtual infrastructure operates in the normal mode, while levels 3 and 4 are for short-term performance monitoring only when you need to collect detailed information on the objects to solve specific problems.
After all, VMware vSphere has about 600 metrics for different objects – and most of them are needed only for in-depth analysis of performance problems in the virtual environment.
By default, the values are as follows (Level 1 is the default collection level for all intervals):
- Data collected at 5-minute intervals are stored for 1 day.
- Data collected at 30-minute intervals are stored for 1 week.
- Data collected at 2-hour intervals are stored for 1 month.
- Data collected at 1-day intervals are stored for 1 year.
Everything is clear here. You should use that analysis interval during which a significant change in certain metrics (peak loads) can be expected.
The rule here is simple: the longer the interval, the lower statistics level you should use (or the same as for a smaller interval). For example, you can set the level 4 for a 1-day interval, level 3 for two hours, level 2 for 30 minutes and level 1 for 5 minutes. This is specified in the VMware official documentation:
” The statistics level must be less than or equal to the statistics level that is set for the preceding statistics interval. This is a vCenter Server dependency.”
If, for example, you set the level 4 for a 5-minute interval, then in just a couple of days the size of the main statistics table can grow tens of times! Therefore, always be wary of collection levels 3 and 4.
Now, let’s have a look at the levels of statistics collection – which events are collected and what are the best practices for them:
| Levels | Metrics | Best practices |
|---|---|---|
| Level 1 |
|
Level 1 is the default collection level for all intervals, a normal mode of virtual infrastructure operation. |
| Level 2 |
|
Level 2 can be used for long-term performance monitoring when more information is required. |
| Level 3 |
|
This level should be used to troubleshoot a virtual infrastructure or devices operation. Storing these metrics takes a lot of space, thus keep them for a short time (a day or a maximum of a week) and with long intervals. |
| Level 4 | Level 4 All metrics, including minimum and maximum rollup values It is recommended to use this Level only for short-term troubleshooting during the day, and then return to the collection level to 1 or 2. | It is recommended to use this Level only for short-term troubleshooting during the day and then return to the collection level to 1 or 2. |
Remember that level 1 and 2 metrics are often aggregated (for example, they are aggregated at the host level by storage), but for levels 3 and 4 they are divided by devices (separate datastores of this host in this case).
The VMware vCenter Statistics window also shows the ability to specify the number of hosts and virtual machines in your infrastructure. On the right side of the “Estimated space required” you can see the result of setting the values – the estimated size of the vCenter database based on the values, you’ve set.
In general, vCenter does not have a limit on the database size, but it would be nice if it did not exceed 40-50 GB since if the values are higher it can start working very slowly.
Remember that the built-in vPostgres database on vCenter for Windows has a limit of 200 virtual machines and 20 ESXi host servers. By the way, there is no such limitation for the vCenter Server Linux Appliance.
Well, we also must understand that the calculator shows the expected size of the statistical data and does not take into account other tables (for example, tables with tasks and events that can also have a very significant effect on the size of the occupied space).